Apparel Production Planning Software For Large Garment Manufacturers In Bangladesh
by Kunal Kapur
 9
Mins Read
9
Mins Read
- Key Takeaways
- The Quote Arrives as a Single Number
- Why a Supplier Quote Is Never Just a Price
- Why “just send me a breakdown” is not enough
- What “Accurate” Actually Means
- Why labour is the variable that decides the quote
- The Independent Anchor: Standard Minute Value
- SMV and SAM: same measure, different label
- Predetermined motion time systems vs stopwatch time study
- Building the Cost Breakdown Before You Order
- Reading the Gap Between Your Number and Theirs
- When a higher quote is the better deal
- Separating fair-wage cost from inflation
- Red flags in a supplier breakdown
- Comparing Breakdowns Fairly Across Multiple Suppliers
- Issue one Bill of Labour and lock the SMVs
- Build vs Buy: Do You Need Software for This?
- What a spreadsheet and a trained partner can do
- What breaks at scale
- What a costing platform adds
- Walk In With Your Own Number
- Frequently Asked Questions
Key Takeaways
- Large Bangladeshi groups fail at planning scale, not planning logic. The method works in one unit and collapses across twelve.
- ERP records commercial commitments. It does not schedule finite capacity against style-specific SMV, changeovers, and buyer critical paths.
- Finite capacity scheduling with what-if replanning is the core requirement. A reporting dashboard is not a planning system.
- Group-level order book consolidation comes first. You cannot allocate across units you cannot see in one view.
- Plan-to-execution variance, not plan quality, separates mature planners from optimistic ones.
- SMV accuracy caps plan accuracy. Verifying the real method on the floor is now a planning input, not just an IE task.
- Enterprise implementation risk is organisational. Data governance and IE ownership decide the outcome.
- Returns come from on-time delivery, avoided air freight and recovered capacity, not headcount reduction.
If each factory plans well, the group can still ship late.
That is not a contradiction. It is the defining planning problem at group scale, and it is why adding units rarely adds the capacity the business case promised.
Ask any group planning head what happened the last time fabric slipped ten days on a peak-season order. Someone rebuilt a spreadsheet over a weekend. Two units were consulted separately. A washing plant slot got reallocated, quietly pushing a second order into overtime. The goods shipped, some by air, and nobody costed the recovery because there was no baseline to cost it against.
The short answer, for anyone evaluating right now. Apparel production planning software is a finite capacity scheduling system, not a reporting layer. Above one factory, four things decide whether it works: group order book consolidation, allocation logic that understands unit specialism and buyer approval, changeover-aware scheduling built on accurate SMV, and what-if replanning. Data readiness and governance determine the outcome far more than software configuration does.
This guide covers how to evaluate that decision: what the software actually does, the nine capabilities that matter at multi-unit scale, a six-step evaluation process, realistic implementation sequencing, what it costs, and how to build a business case that survives a board review. Product fit comes last, judged against the framework built here.
Why Garment Planning Breaks Down At Group Scale
Planning has moved up the agenda in 2026 because the room for absorbing planning failure has narrowed.
Merchandise exports for FY2025-26 closed at roughly $48 billion, down 0.58 per cent year on year and short of the $55 billion target, with RMG down around 1.64 per cent. In the US market, price and volume both moved against Bangladeshi exporters. Over the first seven months of 2026, export value fell 6.50 per cent year on year to $4.66 billion, shipment volume fell 4.34 per cent to 1.53 billion square metre equivalents, and the average unit price fell 2.26 per cent, on US Office of Textiles and Apparel data. The price figure is the one to watch. Across all suppliers to the US market, the average unit price rose 0.84 per cent over the same period. Bangladeshi manufacturers were discounting into a market that was not discounting, which is what absorbing a tariff burden looks like in the trade data.
Two structural constraints sit alongside that. BGMEA president Mahmud Hasan Khan has been consistent that electricity and gas supply is the binding constraint. In April 2026, he told the Ministry of Power, Energy and Mineral Resources that insufficient supply had cut factory production capacity by 25 to 30 per cent, with Gazipur and Ashulia worst affected. And Bangladesh leaves the least developed country category on 24 November 2026. Everything But Arms access to the EU is preserved through a three-year transition running to around the end of 2029. The framework that follows is the new GSP Regulation (EU) 2026/1395, adopted on 28 April 2026 and applying from 1 January 2027 for ten years.
Demand growth is not reliably available, energy caps affect capacity, and tariff headroom has a date on it. For a group running ten or more units, the largest recoverable margin is no longer on the floor. It sits in the gap between the capacity the group owns and the capacity the group can see, model, and commit.
One unit vs twelve: what actually changes
At one unit, planning is a scheduling problem. A good planner holds the order book, the line list, and the constraints in working memory, and a spreadsheet expresses them well enough. Plenty of single-unit factories in Bangladesh plan this way excellently.
At twelve units, planning becomes a coordination problem. Four things break at once.
Visibility fragments: A group running woven, knit, denim and outerwear across multiple sites for twenty or more buyers holds an order book nobody sees end to end. Allocation happens on partial information by definition, and the person deciding usually knows it.
Capacity becomes contested: Shared or specialist capability gets committed twice: a washing plant, an embroidery unit, a machine gauge, a line with the skill profile for technical outerwear. Two units book against it independently, both plans look valid, and the clash surfaces the week it becomes unfixable.
Replanning cost rises non-linearly: In one unit, a fabric delay is a two-hour rework. Across twelve units with linked pre-production and material dependencies, it is a weekend. Groups respond rationally by replanning less often, so the plan is stale exactly when volatility peaks.
Buyer-approved factory lists make spare capacity unusable: Compliance status, audit outcomes and nominated unit lists mean minutes are not fungible. A unit with open capacity may be ineligible for the order that needs it, and any method treating capacity as one pooled number will keep producing plans that fail commercial review.
Excel does not fail because it is Excel. It fails because it cannot hold a finite capacity model across sites, cannot enforce version control across planning teams, and cannot be replanned fast enough for a volatile order book.
Five signs you have outgrown Excel
Groups rarely change on principle. They change when the symptoms become undeniable.
- Merchandising asks for a date and gets an estimate. Order acceptance has become negotiation rather than calculation.
- A full group replan takes more than a day. If a scenario costs a weekend, nobody runs scenarios, and the group plans blind between crises.
- Unit-level “real” plans sit alongside the official one. Shadow spreadsheets are not indiscipline. They are a rational response to a system people do not trust.
- Nobody can state last week’s plan-to-execution variance. If the number does not exist, efficiency assumptions have never been corrected and optimism compounds every season.
- Air freight decisions get made in the final ten days. Delays are being discovered rather than predicted, which means the critical path is a record instead of a warning.
Three or more together is a diagnosis, not yet a software decision. The software question comes after it.
Why ERP does not fix planning
Most large Bangladeshi groups have already spent heavily on ERP, and the first reaction to a planning proposal is that the capability should be in there somewhere.
ERP is a transactional system of record. It captures what was ordered, purchased, received and invoiced. Its planning modules typically schedule on infinite or heavily simplified capacity assumptions, because generic manufacturing logic was never built for style-specific standard minute values, changeover penalties, learning curves on new styles, or the pre-production critical path that decides whether a line can start at all.
ERP records the commitment. It does not test whether the commitment is schedulable.
That is scope, not criticism. The mature configuration at enterprise scale runs both: ERP as the transactional backbone, a specialist engine as the scheduling layer, connected by an order, style and material feed. Groups that force one system to do both jobs usually end up planning in spreadsheets anyway, alongside an expensive system of record nobody consults for a delivery date.
What Is Apparel Production Planning Software?
Apparel production planning software is a finite capacity scheduling system. It consolidates confirmed and forecast orders across units, sequences them against style-specific SMV, line efficiency, changeovers and material readiness, and maintains a live critical path from order confirmation to shipment. Unlike ERP, it tests whether a commercial commitment is physically schedulable before it is made.
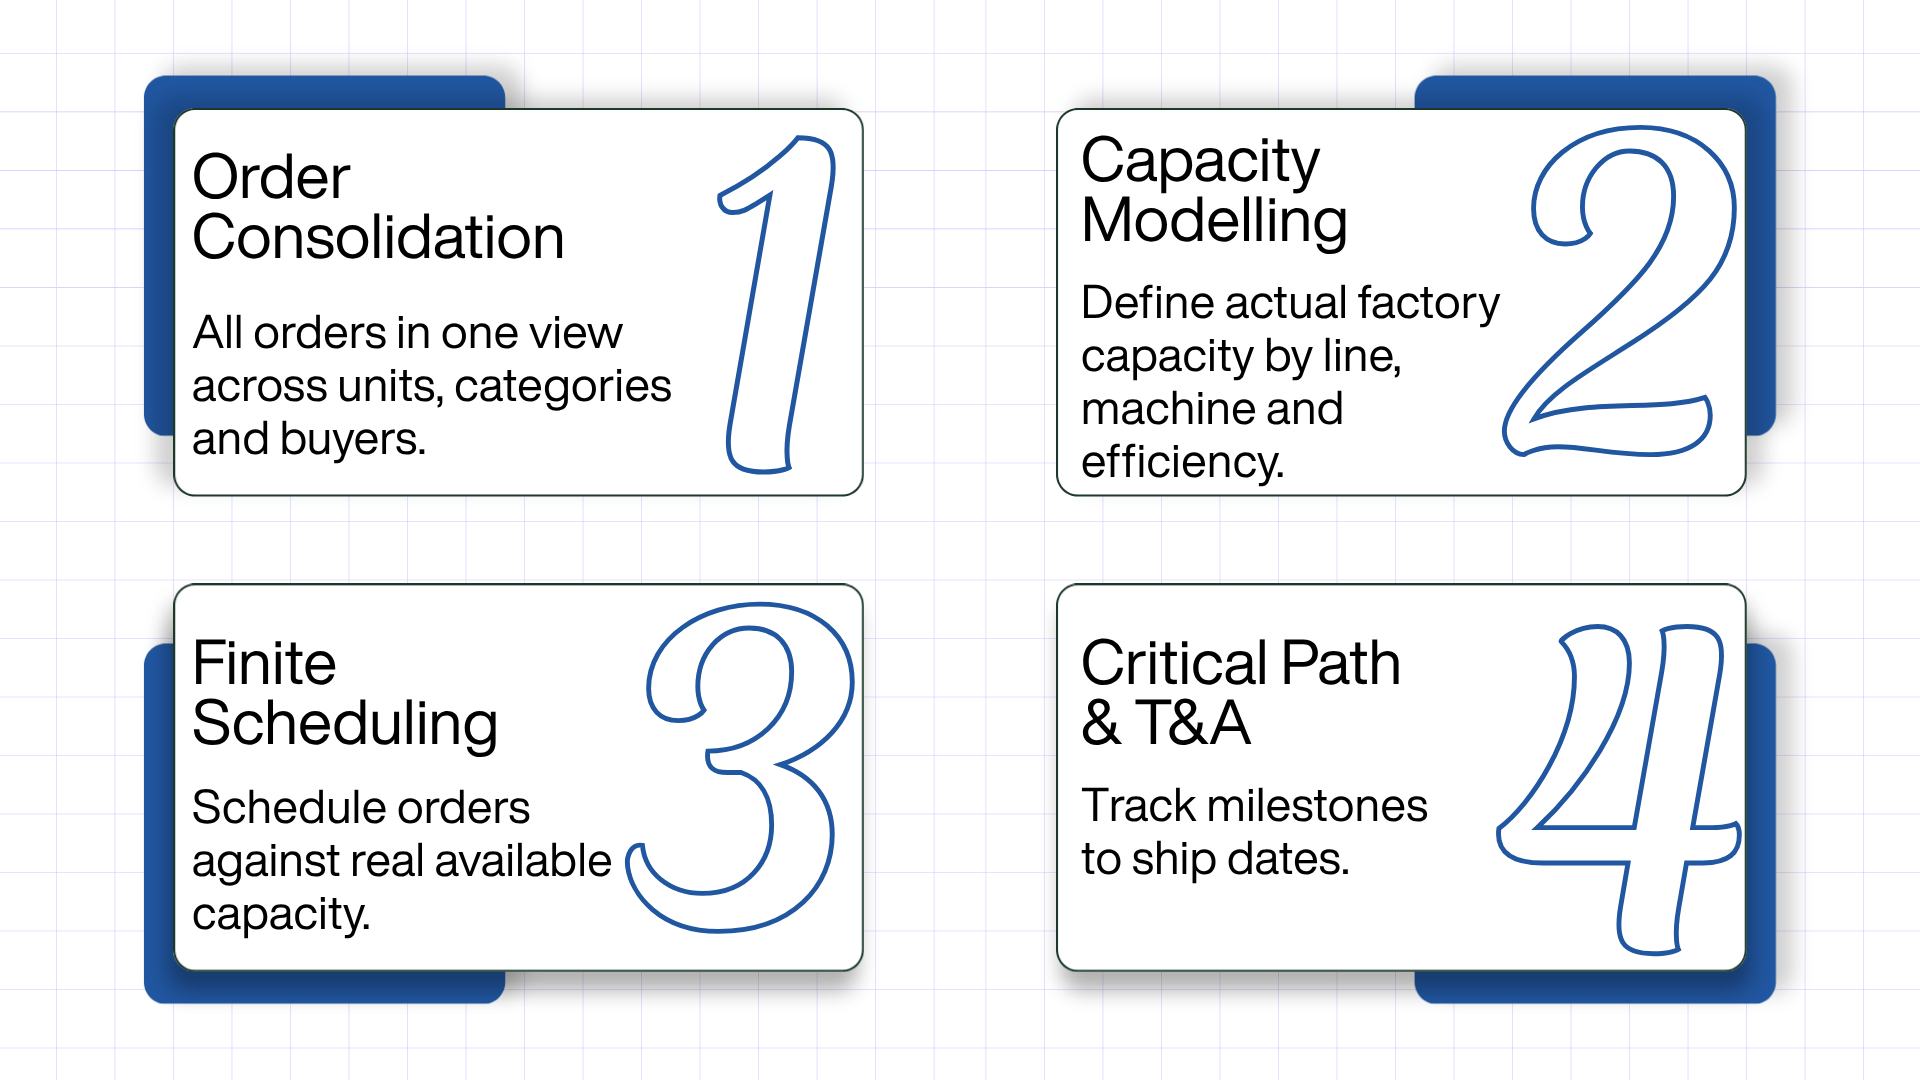
The four layers of a planning system
The layers are dependent in sequence. Each is unreliable without the one above it, which is why groups that buy for layer three and neglect layer one struggle to realise value.
- Order book consolidation: Every confirmed, forecast and speculative order in one structure across all units, categories and buyers.
- Capacity modelling: Lines, units, machine types, standard minute values, efficiency profiles, learning curves and changeover time. The output is factory-defined capacity: what a line can actually produce, not what a monthly average implies.
- Finite capacity scheduling: Orders placed against capacity that genuinely exists in each period.
- Critical path and T&A management: Fabric booking, trim delivery, sample submission, approvals, PP meeting and inspection milestones, backwards-scheduled from the confirmed ship date, with alerting when a milestone slips.
The capability separating enterprise-grade systems from the rest is what-if replanning. A group with a scenario engine models a fabric delay against the whole network in minutes and evaluates recovery options before committing to any of them. A group without one meets the same problem eight days before shipment, when the only lever left is a freight forwarder.
Master planning vs line planning
The two get conflated in evaluation, and the confusion leads groups to buy for the wrong layer.
Master planning is the group-level view. It answers whether the group can take an order, which unit should run it, and how load sits across factories over coming months. It works in weeks and units.
Line planning is the detailed schedule inside a unit. It answers which line runs which style on which day, in what sequence, against real standard minutes and efficiency curves. It works in days and lines.
Large groups need both, connected. Master planning alone produces allocations units cannot execute. Line planning alone reproduces the visibility problem one unit at a time.
ERP vs PLM vs planning software vs MES
Evaluation conversations get much shorter once system boundaries are explicit.
| Function | ERP | PLM | Planning software | MES / shop floor |
| Order and PO records | Owns | Reference | Consumes | — |
| Style, BOM, tech pack | Reference | Owns | Consumes | Reference |
| SMV / method data | — | Reference | Consumes | Reference |
| Finite capacity scheduling | Limited | — | Owns | — |
| Critical path / T&A | Limited | Partial | Owns | — |
| Line-level execution data | — | — | Consumes | Owns |
| What-if scenario planning | — | — | Owns | — |
The planning system consumes more than it owns. It owns finite capacity scheduling and scenario modelling, and depends on clean inputs from everything else. That dependency is why data readiness dominates implementation outcomes.
What is finite capacity scheduling?
Finite capacity scheduling places orders against the capacity that actually exists: real available minutes per line, adjusted for efficiency, learning curves, changeovers and skill availability. Infinite capacity scheduling assumes the work fits into whatever period you assign it to.
If the evaluation has to come down to one question, this is it. Everything else in a planning system is either an input to that calculation or a consequence of it. A system producing attractive Gantt views without a finite capacity engine underneath is a planning report. It will describe the plan accurately and tell you nothing about whether the plan is possible.
Nine Capabilities To Demand At Group Scale
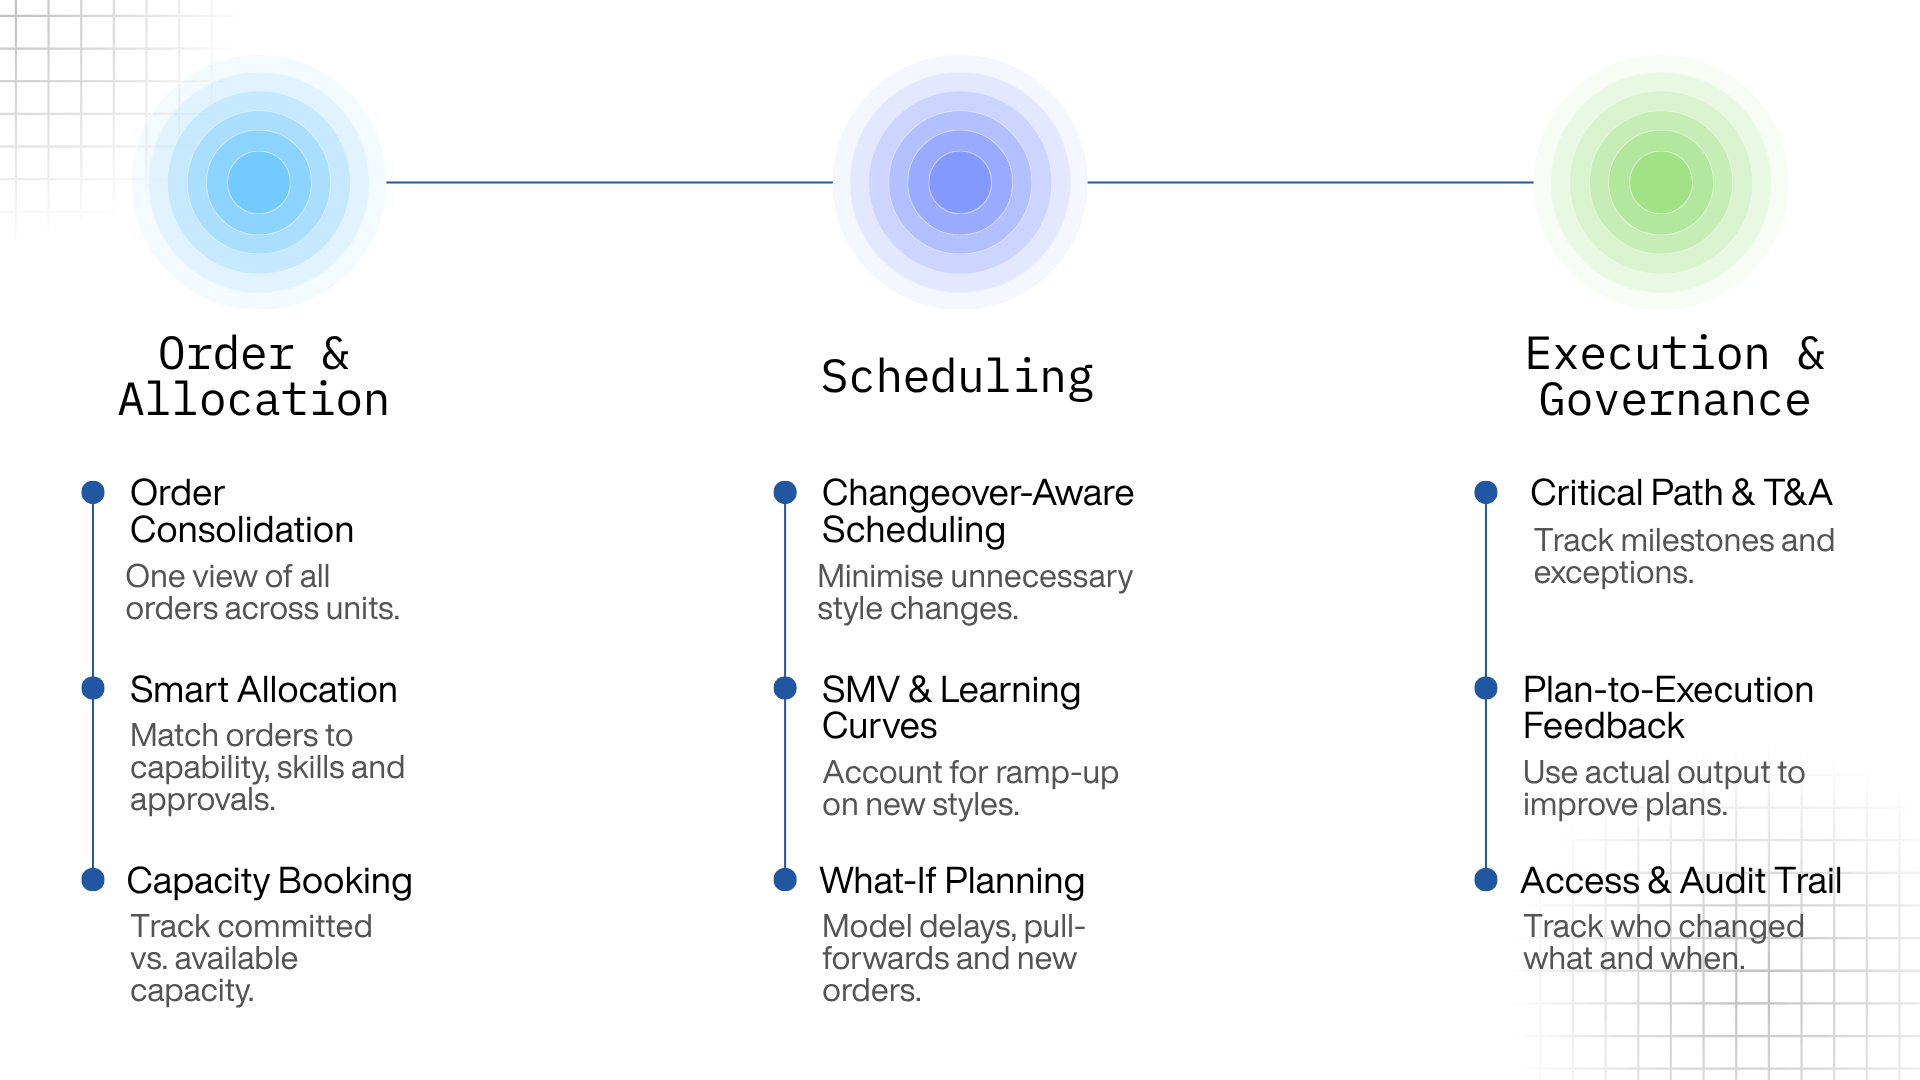
Use these as an RFP scoring sheet, weighted to your own pain points rather than the vendor’s demo emphasis.
Order book and allocation (1–3)
- Group order book consolidation: Confirmed, forecast and speculative orders in one view across all units and categories.
- Multi-unit allocation logic: Allocation by style-machine fit, unit specialism, compliance status and buyer-approved unit list, not by whoever happens to have space.
In practice: a denim-specialist unit with 40,000 open minutes is not a candidate for a technical outerwear order needing bartack and seam-seal capability, even though a capacity report shows it as available. Allocation logic that cannot express machine capability, skill profile and buyer approval will keep producing plans that merchandising overrides by hand, and every override erodes trust in the system.
- Booking horizon management: A rolling view of committed versus open capacity by unit, month and product type. This is what lets merchandising accept an order with confidence rather than optimism.
Scheduling engine (4–6)
- Changeover-aware scheduling: The engine must penalise unnecessary style changes, not just fill minutes. A plan showing a line at 100 per cent load with six style changes in a week has destroyed the efficiency it appears to have captured. On short-run knit, changeover frequency is often the largest controllable efficiency loss in the group.
- SMV-driven line loading with learning curves: Capacity for a new style is not capacity for a running style. A system ignoring ramp-up over-commits every new style it schedules, and a group handling 300 style changes a month will be over-committed permanently.
- What-if scenario planning: Model a fabric delay, an order pull-forward or a new enquiry against the live model without disturbing the committed plan.
Execution and governance (7–9)
- Critical path and T&A management: Backwards-scheduled material, sample, approval and inspection milestones with exception alerting, held inside the planning system rather than beside it.
- Plan-to-execution feedback loop: Actual output feeds back to correct efficiency assumptions. Without it, the same optimistic numbers get reused every season, and the plan degrades quietly.
- Role-based access and audit trail: Who changed the plan, when and why. Audit-grade planning matters for group governance and increasingly for buyer scrutiny during vendor reviews.
Scoring table: Excel vs ERP vs specialist software
| # | Capability | Why it matters at scale | Excel | ERP module | Specialist planning software |
| 1 | Group order book consolidation | Prevents double-booked capacity | Partial | Partial | Full |
| 2 | Multi-unit allocation | Matches style to the right unit | Manual | Limited | Full |
| 3 | Booking horizon view | Enables confident order acceptance | Partial | Limited | Full |
| 4 | Changeover-aware scheduling | Protects real efficiency | No | No | Full |
| 5 | SMV + learning curve loading | Realistic new-style capacity | Manual | Limited | Full |
| 6 | What-if scenarios | Fast, safe replanning | No | No | Full |
| 7 | Critical path / T&A | Surfaces delays early | Partial | Partial | Full |
| 8 | Plan-to-execution loop | Self-correcting assumptions | No | Partial | Full |
| 9 | Audit trail | Governance and buyer trust | No | Partial | Full |
Planning Around An Energy-Constrained Capacity Base
Available minutes in Bangladesh are not a fixed number this year, and a capacity model that treats them as one will over-commit every month it runs.
Groups with in-house dyeing, printing, and finishing feel it first, because backward-linkage processes depend on gas pressure rather than grid electricity. A delayed fabric release moves the sewing start date whatever the sewing plan says, which means the constraint enters the schedule two stages upstream of where most planners look for it.
Three implications for the capacity model:
Build efficiency profiles from constrained-period output, not nameplate capacity. If your baselines were set in a year of stable supply, every plan drawn from them is optimistic by roughly the size of the current shortfall, and the plan-to-execution variance will show it as a line problem rather than a supply problem.
Put generator cost into the allocation decision. When two units can both take an order, the one running on diesel-backed supply is not the cheaper option. An allocation engine scoring only on open minutes will keep choosing it, and the cost will surface in the P&L rather than the plan.
Model supply disruption as a scenario, not an exception. A group that can run a what-if for a week of reduced gas pressure across the network knows which orders to pull forward and which units to protect. A group that cannot will find out during the week itself, when the only remaining lever is overtime or air freight.
This is the point where the difference between a reporting dashboard and a scheduling engine stops being philosophical and becomes financial.
How To Evaluate Planning Software In Six Steps
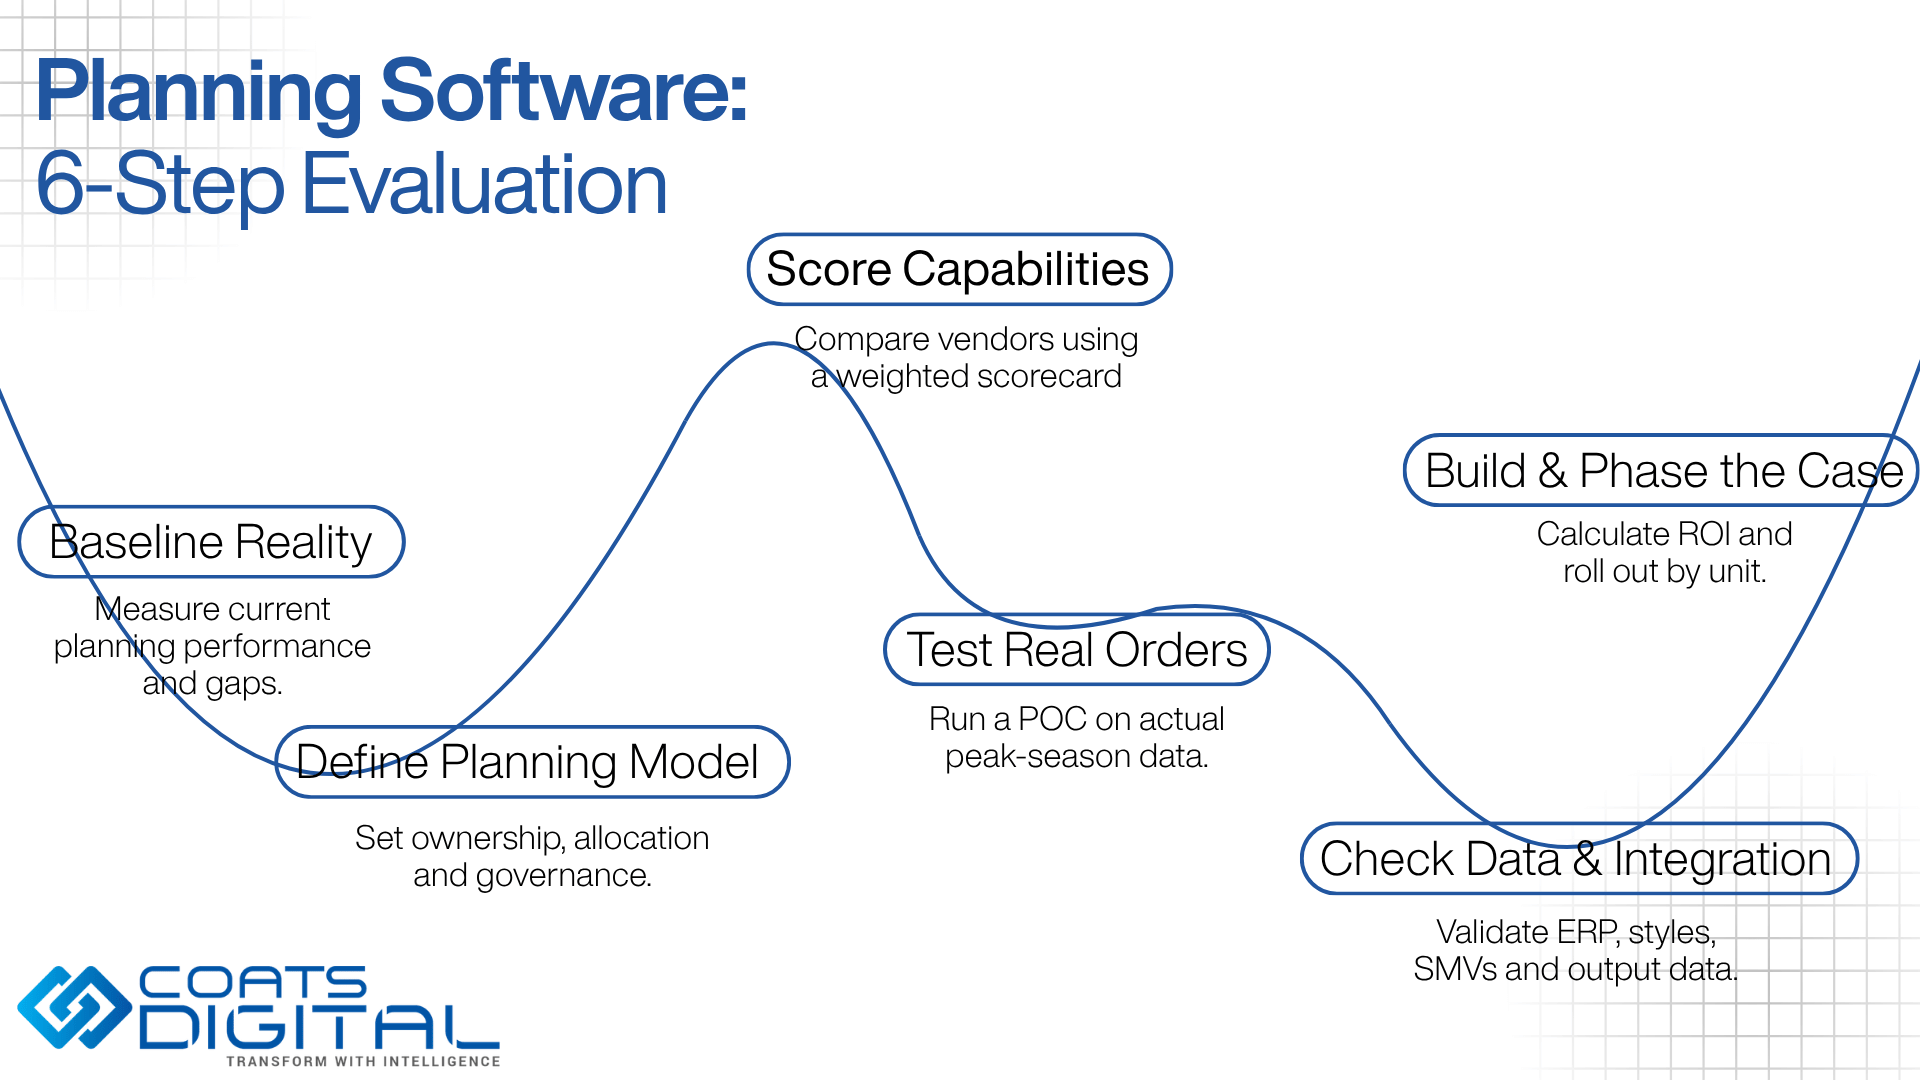
Step 1. Baseline your planning reality
Document how many planning systems are genuinely in use across the group, including unit-level spreadsheets nobody officially sanctioned. Record replanning frequency, hours per replan, plan-to-execution variance, on-time delivery performance and air freight incidence.
Output: a baseline scorecard signed off by the group planning head.
Failure mode: evaluating without a baseline. If you do not know where you started, return can never be demonstrated, and a successful implementation gets treated afterwards as a cost centre.
Step 2. Define the splanning model first
Decide whether allocation is centralised, unit-led or hybrid. Name the owner of the master plan. Define the escalation path when a unit disputes an allocation.
There is a real trade-off that deserves a decision rather than a default. Centralised allocation optimises the group and reduces unit autonomy, which unit heads carrying P&L responsibility will resist. Unit-led allocation preserves accountability and reproduces the visibility problem. Most large groups land on a hybrid: the group owns allocation across units, the unit owns detailed line scheduling within its allocation. Whichever you pick, pick it before the demo cycle starts.
Output: a one-page target operating model.
Failure mode: buying software to settle an undecided governance question. It will encode the ambiguity and make it visible to everyone at once.
Step 3. Score against the nine capabilities
Use the table above as an RFP scoring sheet, weighted to your situation. A group with stable products and volatile materials weights differently from one adding a category next season.
Output: a weighted vendor scorecard.
Failure mode: demo-driven evaluation, where the best presenter wins. Require every vendor to answer the same nine questions in the same format.
Step 4. Test on your own order book
Insist on a proof of concept using one real peak-season month across at least two units, including the styles that caused the most trouble.
Output: POC results measured against a known historical outcome. You already know what happened that month, which makes it the only honest test available.
Failure mode: clean demo data hides how an engine copes with your style complexity, changeover frequency and material volatility.
Step 5. Assess integration and data readiness
Confirm the ERP order feed, the style master, the SMV source and the mechanism for capturing actual output. Name the gaps explicitly rather than assuming they resolve during implementation.
Output: an integration map and a data remediation list with owners and dates.
Failure mode: discovering mid-implementation that reliable SMV data does not exist for a large share of running styles. The most common cause of stalled projects, and entirely predictable in advance.
Step 6. Build the case and sequence the rollout
Quantify the current cost of the failure modes you baselined in step one. Sequence rollout by unit and set the decision gate between phases.
Output: a board-ready business case with payback calculated per phase.
Failure mode: a group-wide big-bang rollout, presented as decisiveness and experienced as chaos.
How Long Does Implementation Take?
Timelines vary with data readiness and group size far more than with software configuration. A single pilot unit moves considerably faster than a group-wide deployment, and phased rollouts consistently outperform big-bang ones. Any vendor quoting a confident group-wide timeline before seeing your style master and SMV coverage is quoting a guess.
The four-phase rollout sequence
Pilot unit, adjacent unit, category rollout, group consolidation. Each phase validates data quality and governance before the next begins.
Pilot selection matters more than most groups expect. Choose a unit with a mid-complexity product, a competent industrial engineering team and a unit head who actively wants the system. The instinct to pilot in the worst-performing unit is understandable and wrong: it tests the software against the hardest data and the weakest management conditions at the same time, and failure there tells you nothing useful.
What data do you need before go-live?
The prerequisite work is data, not software.
- A clean style master with consistent style and colour identifiers across units
- SMV or SAM coverage across the majority of running styles, ideally method-based rather than estimated from historical output
- A machine and line inventory with capability attributes, not just counts
- Historical efficiency baselines by line and product type
- A working mechanism for capturing actual output at line level
Groups with thin SMV coverage should budget remediation time explicitly. Missing SMV forces planners to override system capacity manually, and manual override at scale defeats the system within a season.
The organisational risk nobody budgets for
The dominant risk at enterprise scale is political, not technical.
A planning system ends merchandising’s ability to promise a ship date informally. That is a redistribution of authority, and it is consistently the most underestimated part of implementation. IE must own the capacity model. Merchandising owns the order book. Production owns execution feedback. Ambiguity across those three boundaries causes more failures than any technical issue, and software cannot resolve it on anyone’s behalf.
| Risk | Signal it is happening | Mitigation |
| Incomplete SMV coverage | Planners overriding system capacity manually | Run SMV remediation before go-live |
| Merchandising bypasses the plan | Orders confirmed outside the system | Make the system the only source of a confirmed date |
| Shadow spreadsheets return | Unit-level “real” plans reappear | Single source of truth policy, enforced at group level |
| No execution feedback | Plans stay optimistic; variance never closes | Mandate daily or weekly actual output capture |
| Ownership ambiguity | Plan changes with no accountable owner | Define RACI before go-live; IE owns the capacity model |
How Do You Measure ROI?
Return does not come from headcount reduction. Planners do not disappear. They stop rebuilding spreadsheets and start managing exceptions, which is what you hired them to do.
Build the case on avoided cost first, because it is the most defensible with a CFO: air freight, buyer discounts, chargebacks, expedited trims, and idle capacity you paid for regardless. Recovered capacity comes second, and at group scale it is usually the larger number.
Seven metrics to baseline and track
| Metric | Definition | Why it moves | Cadence |
| On-time in-full (OTIF) | % of orders shipped complete on the confirmed date | Realistic dates, earlier delay visibility | Monthly |
| Plan-to-execution variance | Planned versus actual output per line per week | Corrected efficiency assumptions | Weekly |
| Capacity utilisation | Loaded minutes ÷ available minutes | Better allocation across units | Weekly |
| Air freight incidence | % shipments air-freighted versus planned sea | Delays surfaced early enough to recover | Monthly |
| Changeover time loss | Minutes lost to style changes | Changeover-aware sequencing | Monthly |
| Replanning cycle time | Hours to produce a revised group plan | Scenario engine replaces manual rebuild | Per replan |
| Order acceptance confidence | % orders accepted against verified open capacity | Booking horizon visibility | Monthly |
What does planning software cost?
Specialist vendors, Coats Digital included, quote against scale and scope rather than publishing list prices, because cost is driven by your variables: units and lines in scope, order volume, optional modules, integration complexity and rollout phasing.
What you can budget for with confidence is the shape of the total cost. The mistake most groups make is costing only the first line of it.
- Software licensing or subscription, usually scaled to units and users
- Implementation and configuration, including the capacity model build
- Integration against ERP, PLM and shop floor data capture
- Data remediation, particularly SMV coverage, frequently the largest single line and rarely in the initial budget
- Internal resource: IE, planning and IT time, real cost even when it is not invoiced
- Training and change management across merchandising, planning and production
Ask every vendor to quote per phase rather than for the group. Phase-level costing lets you stop after phase two if the numbers do not appear, and a vendor confident in the product will not resist it.
How to structure the business case
Four parts: current-state cost of failure, target-state improvement against the same metrics, phased investment, and payback per phase rather than for the group in aggregate. Phase-level payback survives a finance committee because it turns one large irreversible decision into a sequence of reversible ones.
A caution on published benchmarks, including ours. Vendor-reported improvement figures are directional evidence, not forecasts. A group already running high OTIF with low air freight has less to recover than one firefighting every season, and an honest business case says so in the first paragraph.
Where The Coats Digital Fashion Intelligence Suite Fits
The framework above is deliberately vendor-neutral. This section maps Coats Digital’s solutions against it. Every capability described comes from current product documentation.
Mapping the nine capabilities to FastReactPlan
FastReactPlan is Coats Digital’s apparel production planning and control solution, built specifically for apparel and footwear manufacturers. Coats Digital reports more than 500 clients across 40-plus countries and over 2,000 factories planned on the system.
| # | Requirement | How FastReactPlan addresses it |
| 1 | Group order book consolidation | Master planning “control tower” board manages total demand, projected and confirmed, across multiple factories |
| 2 | Multi-unit allocation | Informed order allocation and load-versus-capacity management across factories and subcontractors |
| 3 | Booking horizon view | Order confirmation checked against true line and machine capacity before a date is promised |
| 4 | Changeover-aware scheduling | Line and machine scheduling on standard minutes, with connected bottleneck processes sequenced from the sewing plan |
| 5 | SMV + learning curves | Line planning built on standard minutes, efficiency profiles and start-up or training curves |
| 6 | What-if scenarios | Master planners sandbox scenarios including capacity ramp-up or down and reallocation across factories |
| 7 | Critical path / T&A | Pre-production critical path with dynamic target dates, late-event alerts and failure reason codes |
| 8 | Plan-to-execution loop | Production updates imported for plan-versus-actual monitoring and rapid replanning |
| 9 | Audit trail and governance | Shared departmental priorities across merchandising, planning and production, integrated reporting and optional Power BI KPI dashboards. Confirm role-based access and plan change-logging against current documentation during evaluation |
One caveat on row nine, since the framework above is the client’s not the vendor’s. Shared priorities and integrated reporting are not the same thing as a change-level audit trail, and the requirement as written asks who changed the plan, when and why. Put that question to every vendor on the shortlist, including this one, and ask for a demonstration rather than a datasheet.
Two capabilities deserve singling out at 10,000-plus machines. Material requirements are calculated dynamically on LEAN pull principles from the latest sewing plan, with inventory and open purchase orders imported from the business system, giving fabric mills and trim suppliers early visibility of real priorities rather than chased ones. And for very high order volumes, the optional Advanced Planning and Scheduling module plans large volumes across multiple constraints at once.
FastReactPlan in Bangladesh: two examples
Epyllion Group, with units in Dhaka and Gazipur, manages a minimum of 300 style changes a month at quantities from 500 to 100,000 pieces. Running pre-production and order prioritisation through spreadsheets and email had become a ceiling on growth. The group built a central planning team around FastReactPlan from 2008. In the published account, Azhar Farook, Assistant General Manager for Planning, reported on-time production start rising to 85 per cent and on-time delivery performance to 95 per cent over the following year, with the fabric mill delivering 95 per cent on time. Note the sequence: the mill improved because the plan gave it priorities early, not because anyone chased harder.
Azim Group operates 13 garment manufacturing units and four backward-linkage factories across Dhaka and Chattogram. In figures published in January 2022, Ehsan Islam, Operations Manager, reported a 15 per cent increase in planning efficiency in the first year and order confirmation turnaround falling from two days to roughly 30 minutes.
Both sets of figures are customer-reported and vendor-published, and both describe deployments now several years old. Treat them as directional evidence of what the category can do, not as an audited benchmark or a forecast for your group.
What is GSD RealMotion?
GSD RealMotion is an AI-powered motion analysis solution that turns shop-floor video into structured, GSD-coded method studies. An engineer uploads a phone video, AI detects and codes the motions, and RealMotion builds the actual method with observed time attached motion by motion, showing where time is lost, why, and what to change. It launched on 19 August 2026.
Coats Digital positions it as an intelligent shop floor layer that turns disconnected shop-floor data into actionable operational intelligence, combining AI-powered video motion analysis, sewing machine integration, trusted GSD standards and connected production insights. In the company’s framing, RealMotion extends the GSD standard onto the factory floor.
Why a planning evaluation should care. Every capacity number a planning system produces derives from SMV. If the SMV was built from a method the floor does not actually run, the plan is precise and wrong. Planners lose confidence, manual overrides return, and the group ends up back where it started with a more expensive spreadsheet. RealMotion is the mechanism that finds and corrects that drift at scale, which makes verified method a planning input rather than only an IE exercise.
Seven things it does, and what each one means for the plan:
| What RealMotion does | Why it matters to planning |
| Codes the video as it finds it, instead of mapping footage onto the motion codes the style was originally costed with | The discrepancy between the costed method and the floor method survives the analysis rather than being smoothed away by it, and that discrepancy is what corrupts the capacity model |
| Compresses a 45-minute stopwatch study to roughly 15 minutes of video-assisted work, and brings the eight-hour manual method breakdown into practical range | SMV coverage stops being rationed by engineering hours, so more running styles carry a verified standard rather than an estimated one |
| Attaches an observed time to every motion and labels it value-added, necessary or non-value-added | Losses become specific — a named motion, a measured duration, a known position in the sequence — which is the condition for engineering them out |
| Distinguishes variance an engineer can act on from variance built into the line | Improvement effort concentrates where it changes the number, instead of dispersing across differences nobody can close |
| Measures the observed method against the engineered GSD standard held in GSDCost | The comparison is against an engineered reference point, not against the line’s own recent performance, which drifts with it |
| Stores every completed study in a shared, searchable GSD-coded library | The method record belongs to the business rather than to whichever engineer ran the study |
| Publishes verified observed standards back into GSDCost under approval | The next quote and the next capacity model are built on the method the floor actually runs |
Coats Digital lists the benefits as reduced study time, real-time visibility into machine performance, productivity recovered within the shift, improved costing accuracy and standardised best practice across lines and factories. Those are the vendor’s claims for the product, not measured outcomes at a named site.Its internal modelling indicates potential annual savings of $2–3 million per site, around 60,000 additional garments a year from recovered capacity, and 12,000 engineering hours saved annually. Those are modelled figures published by the vendor rather than audited results, and they will vary with your baseline.
For a Bangladeshi group, the practical read is straightforward. If SMV coverage is the reason your planning project would stall, RealMotion is the tool that removes the coverage constraint. If your planners already override the system because they do not believe the standard minutes, it is the tool that rebuilds the standard they will believe.
How the four solutions work together

This is where a connected fashion intelligence suite matters more than any single product, because a scheduling engine is only ever as good as the data feeding it.
VisionPLM sits upstream, managing range planning, design integration, material management, tech packs, costing and critical path for the styles that will eventually be scheduled. Clean style and BOM data originates here.
GSDCost supplies method-based standard minute values using internationally recognised standard motion codes and predetermined times, rather than SMVs estimated from historical output. Method first, then loading. GSDQuest extends the same methodology by generating a standardised Bill of Labour from product images, closing coverage gaps on styles that would otherwise go uncosted.
FastReactPlan schedules against that capacity model, consolidates the group order book and manages the critical path to shipment.
GSD RealMotion closes the loop from the floor back to the standard, and the loop is the point. VisionPLM improves the style data. GSDCost engineers the method. RealMotion verifies the method against what operators actually do and corrects it. FastReactPlan schedules against a capacity model that gets more accurate each season instead of quietly degrading.
That is intelligence that compounds. Each layer raises the ceiling on the next, and planning accuracy becomes a function of accumulated method knowledge rather than of how hard the planning team works.
For groups at 10,000-plus machines, the deployment pattern that works is unit-level scheduling with group-level order book consolidation above it. A single monolithic plan across a large group is slower to maintain and slower to replan than a consolidated control tower over unit-level boards.
Local implementation capability matters more at enterprise scale than feature parity, because the hard part of the project happens in the factory rather than in the software. Coats Digital maintains an office in Uttara, Dhaka, alongside Coats Group’s long-standing manufacturing presence in Gazipur and Chattogram.
What planning software will not solve
Worth stating plainly, because it saves everyone time during evaluation.
Planning software cannot fix absent SMV data. It cannot resolve undefined governance. It cannot correct a merchandising culture that commits dates outside the system. Software enforces a discipline. It does not create one. Groups treating a planning implementation as an IT project rather than an operating model change see shadow spreadsheets return within a season, and they are usually right to blame the project rather than the product.
Should You Build Or Buy?
Most large Bangladeshi groups have already built something: an elaborate Excel system, an in-house planning module, a heavily customised ERP screen. These builds are usually competent, and they usually succeed at the same thing. They record the plan.
Where they stall is optimisation. Finite capacity scheduling with changeover penalties, learning curves and multi-constraint sequencing is a specialist engineering problem, not a reporting one. A team that builds excellent integrations will not necessarily produce a scheduling engine, and the attempt consumes IT capacity the group needs elsewhere.
The costs that rarely make it into the build case are maintenance, key-person dependency and opportunity cost. A planning tool one person fully understands is a governance exposure in a business where the plan is the commercial commitment.
| Consider building if | Consider buying if |
| Product mix is genuinely unusual | Product mix is standard woven, knit or denim |
| Genuine in-house planning-science capability exists | The IT team’s strength is integration, not algorithms |
| Single unit, stable order book | Multiple units, 15+ buyers, volatile order book |
| No near-term scaling plan | The group is adding units or categories |
The hybrid that works consistently: buy the scheduling engine, build the integrations and internal reporting around it. That keeps in-house IT on data flow, where it adds genuine value, rather than on scheduling algorithms, where it competes with specialists.
Capacity You Cannot See Is Capacity You Cannot Sell
The constraint at enterprise scale is rarely machines. Bangladesh’s largest groups have capacity. What they often lack is the ability to see it in one view, model it honestly against style-specific method data, and commit it to a buyer who wants an answer this afternoon.
As tariff headroom narrows after graduation and energy supply caps effective output, making data-backed commitments becomes a commercial asset rather than an operational nicety. Buyers allocate to manufacturers who hit dates. That is the whole mechanism, and it is why planning discipline converts into order book share.
Three things to do before you speak to any vendor:
- Score your current stack against the nine capabilities above.
- Baseline your plan-to-execution variance and air freight incidence for the last two seasons.
- Identify the peak-season month you would use as a proof of concept, and check whether the data for it still exists.
To test this against your own numbers, Coats Digital can arrange a demonstration using a sample of your real order book rather than demo data.
Frequently Asked Questions
-
What is apparel production planning software?
A finite capacity scheduling system that consolidates an order book, models real line and unit capacity using style-specific SMV, sequences orders against that capacity, and maintains a critical path from order confirmation to shipment. Unlike ERP, which records commercial commitments, planning software tests whether those commitments are physically schedulable and surfaces conflicts before they become late shipments.
-
At what size does a manufacturer need production planning software?
There is no machine count that triggers it. The reliable triggers are structural: a second or third unit, a new product category, a major buyer with tight critical path requirements, or a shift from stable repeat orders to volatile short runs. Well-run Excel planning can serve one unit with a stable order book. It breaks down when capacity must be allocated across units nobody can see in a single view.
-
How do large Bangladeshi groups plan production across multiple units?
Through a consolidated group-level order book with unit-level scheduling beneath it. Orders are allocated to units on style-machine fit, unit specialism, buyer-approved factory lists and available capacity, then scheduled in detail within each unit. The consolidation layer prevents the most common enterprise failure: two units independently committing the same shared capacity.
-
Can planning software handle subcontractors?
Yes, and at group scale it usually has to. Subcontracted capacity should sit in the same master planning view as owned units so load, buyer approval status and critical path milestones are visible in one place. FastReactPlan’s master planning board covers allocation across factories and subcontractors. The common failure is managing subcontractors outside the system, which recreates the double-booking problem the consolidation layer exists to prevent.
-
What is a T&A calendar and why should it sit inside the planning system?
A Time and Action calendar backward-schedules every pre-production milestone, from fabric booking and trim delivery through sample approval, PP meeting, and inspection, from the confirmed ship date. Kept in a separate spreadsheet, it becomes a record of what should have happened. Inside the planning system, a slipped milestone automatically flags the affected production slot, giving planners weeks of recovery time rather than days.
-
How do you build a business case for planning software?
Baseline first: on-time delivery, air freight incidence, plan-to-execution variance, capacity utilisation and replanning cycle time. Quantify the current cost of failure, including air freight, discounts, chargebacks, expedited trims and idle capacity. Then model target-state improvement against the same metrics, sequence the investment by rollout phase, and calculate payback per phase rather than in aggregate.
-
What ROI should a manufacturer expect?
Returns come from delivery reliability, freight avoidance and capacity recovery, not headcount reduction. The size depends entirely on the baseline: a group already at high OTIF with low air freight has less to recover than one firefighting every season. Vendor benchmarks, Coats Digital’s included, are directional rather than predictive.
-
How does SMV accuracy affect planning performance?
Directly and severely. Every capacity calculation derives from SMV, so a plan can never be more accurate than the method data underneath it. Method-based SMV established through GSDCost gives FastReactPlan an engineered capacity model to schedule against rather than one estimated from historical output. GSD RealMotion extends this onto the floor by benchmarking the method operators actually run against the GSD standard, so drift between costed method and floor reality is corrected instead of quietly degrading every plan built on it.
-
What is GSD RealMotion?
An AI-powered motion analysis solution from Coats Digital that turns shop-floor video into structured, GSD-coded method studies. An engineer uploads a phone video, AI detects and codes the motions, and the system builds the actual method with observed time attached motion by motion, classifying each as value-added, necessary or non-value-added. Studies are benchmarked against the engineered GSD standard held in GSDCost and saved to a searchable library for reuse.
-
Does GSD RealMotion replace traditional time studies?
It replaces the stopwatch and manual frame-by-frame analysis rather than the industrial engineer. Coats Digital reports that a 45-minute manual timing study becomes a 15-minute video-assisted one, and that the roughly eight-hour manual method analysis most factories cannot afford becomes practical. Engineers still validate and refine every study; the shift is from spending their time measuring method to spending it improving method.
-
What is plan-to-execution variance and why does it matter?
It is the gap between planned and actual output per line per period. A sophisticated plan built on optimistic efficiency assumptions fails as reliably as a crude one. Tracking variance weekly and feeding actuals back to correct efficiency curves makes the plan self-correcting. Groups that track variance improve; groups that only produce plans repeat the same errors every season.
-
Is planning software worth it if our Excel planning is strong?
It depends on scale and volatility. Well-run Excel planning can serve a single unit with a stable order book and few buyers. It breaks down across multiple units, where version control fails, replanning takes days, and nobody holds a group-level view. The trigger for change is usually not dissatisfaction with Excel but the addition of a unit, a category, or a major buyer.

How Indian Garment Exporters Manage On-Time Delivery for Multiple Global Buyers at the Same Time

How US Clothing Brands Protect Profit Margins When Supplier Production Costs Go Up

Apparel Production Planning Software For Large Garment Manufacturers In Bangladesh
All Blog Categories
- Production Planning
- Corporate
- Design and Develop
- Fabric Optimisation
- Method Time Cost Optimisation
- Shop floor execution
- Supply Chain Solutions
- Sustainability
- Videos