How US Clothing Brands Protect Profit Margins When Supplier Production Costs Go Up
by Kunal Kapur
 9
Mins Read
9
Mins Read
- Key Takeaways
- The Quote Arrives as a Single Number
- Why a Supplier Quote Is Never Just a Price
- Why “just send me a breakdown” is not enough
- What “Accurate” Actually Means
- Why labour is the variable that decides the quote
- The Independent Anchor: Standard Minute Value
- SMV and SAM: same measure, different label
- Predetermined motion time systems vs stopwatch time study
- Building the Cost Breakdown Before You Order
- Reading the Gap Between Your Number and Theirs
- When a higher quote is the better deal
- Separating fair-wage cost from inflation
- Red flags in a supplier breakdown
- Comparing Breakdowns Fairly Across Multiple Suppliers
- Issue one Bill of Labour and lock the SMVs
- Build vs Buy: Do You Need Software for This?
- What a spreadsheet and a trained partner can do
- What breaks at scale
- What a costing platform adds
- Walk In With Your Own Number
- Frequently Asked Questions
Key Takeaways
- A supplier cost increase splits three ways: fund what is structural, engineer out what sits in the product, and challenge only what has no method behind it.
- Pushing price down without removing work does not cut cost; it moves it to the factory. It returns as quality failures, delays, air freight and markdowns.
- Cost per minute is set by wage law and energy markets. The minutes a garment consumes are set by its construction, and brands control those.
- The maths is symmetrical. A 9% rise in cost per minute is fully offset by an 8.3% cut in Standard Minute Value; a verified 11% cut offsets a 12.4% rise.
- Fair living wage cost is a legitimate upward driver. Fund it, ring-fence it as a separate line, and find the offset through method instead.
- The biggest margin leaks sit downstream of the quote: air freight on a late order and end-of-season markdowns usually dwarf any Cost-to-Make saving.
- US duty policy changed three times in five months in 2026, so the ex-factory cost is the one layer a brand can still control directly.
A VP of Sourcing opens an email from a vendor they have used for a decade. Wage increments, energy, fabric, compliance. Seven per cent, across the whole programme, effective next season. No breakdown. The brand has already swallowed a duty layer it could not pass through, and the CFO has just told the board that gross margin will hold.
The instinct is to negotiate harder. That instinct is incomplete, because most of what the letter contains is real. Wage floors are statutory. Fibre and energy prices track markets that no single factory controls. The number in that email is not one number, and treating it as one is precisely how margin gets lost.
The pressure is well documented. In the BoF-McKinsey State of Fashion 2026, 46% of executives expect conditions to worsen in 2026, up from 39% a year earlier, and 76% say responses to trade disruption and tariffs will be the single biggest theme shaping the year. 45% name sourcing costs as the part of their economic model under the most pressure, ahead of pricing and inventory. The 2026 USFIA Fashion Industry Benchmarking Study, run with the University of Delaware, found 92% of respondents rating protectionist US trade policy among their top two challenges, with concern over rising costs climbing since 2025. What follows is a method for separating a real increase from a padded one, the arithmetic that lets productivity absorb wage inflation, and the six levers that actually move the number.
Why The Usual Margin Levers Have Stopped Working
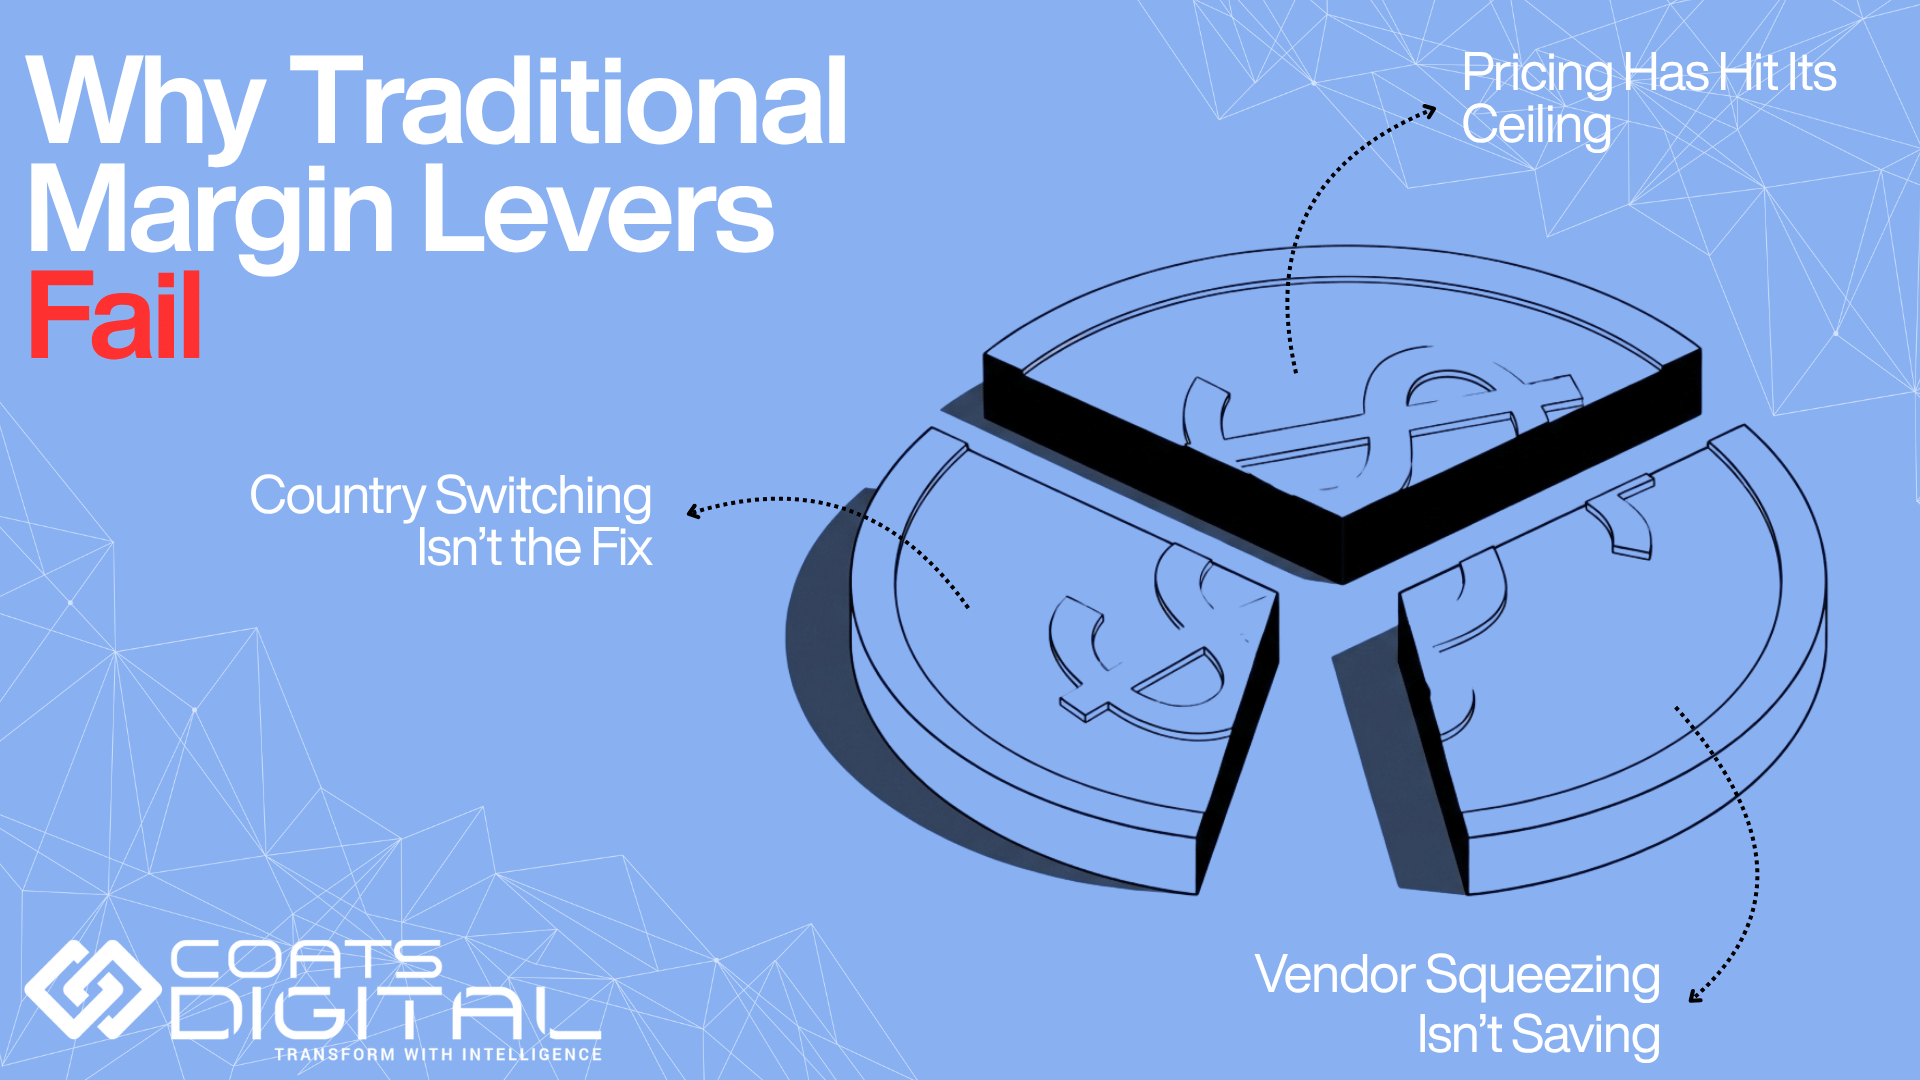
Cost increases feel unwinnable in 2026 because the three levers most teams reach for first have each hit a wall. Naming that wall matters, because it is what makes the method in the rest of this article necessary rather than optional.
Price rises have met the consumer ceiling
Around 71% of executives planned price increases for 2026, with North American brands the most aggressive (State of Fashion 2026). But apparel pricing power is structurally weak, and the pattern through 2025 and 2026 has been gradual, selective increases rather than full pass-through. Levi Strauss took measured pricing actions and still absorbed a 100 basis point gross margin contraction, to 60.8%, in the quarter ended 30 November 2025, driven mainly by tariffs. Pricing is a partial lever with a low ceiling.
Country switching relocates the problem; it does not solve it
Shifting production looks like the obvious move, and 35% of executives said they planned to source more from markets with friendlier trade terms (State of Fashion 2026). Two things have blunted that lever.
- First, the collapse of country-specific tariff differentials in early 2026 narrowed the duty gap between the major Asian bases, wiping out much of the arbitrage.
- Second, the industry has quietly reversed: the 2026 USFIA study found the share of brands planning to add sourcing countries falling to roughly 21%, down from about 59% a year before, with nearly half now intending to reduce their supplier count.
Moving an order to dodge a 5% increase and then losing 8% to a first-season learning curve is a poor trade, and the market has worked that out.
Squeezing the vendor is a loan, not a saving
A price cut that is not matched by a cut in work is borrowed from the factory’s margin, and it comes due later. The Cascale Better Buying Purchasing Practices Index 2025 found suppliers reporting rising pressure from aggressive cost negotiations and price reductions, with progress on responsible purchasing uneven across regions. The distinction that runs through this whole piece is simple. Pricing, country switching and vendor pressure all move cost around. Only changes to method and design take cost out of the product.
What Is Actually Driving The Increase: Five Cost Vectors
Before answering any increase, break it into its components and attach an evidence standard to each. This gives the sourcing team a shared vocabulary and a test it can run on the next supplier call.
| Cost vector | Typical 2026 driver | Evidence a brand should require | Brand’s realistic control |
| Statutory labour | Mandatory annual increments; periodic minimum wage revisions | Gazette notification, payroll structure, contracted hours, effective date | None over the rate; full control over minutes bought |
| Fair living wage | Programme or buyer-driven commitments above the legal floor | Benchmarked wage gap, factory-specific calculation | Should be funded, not negotiated |
| Materials | Fibre, yarn and energy movements; compliance-driven substitution | Dated index reference and mill quotation, not a percentage assertion | Specification, consolidation, utilisation |
| Overhead and compliance | Energy tariffs, audit and certification burden, capex amortisation | Basis of allocation and volume assumption | Order pattern and volume commitment |
| Efficiency and method | Line performance, learning curve, product complexity | Efficiency assumption stated explicitly; operation-level times | Substantial and direct |
Labour: the rate moves on a schedule you can read
Wage escalation in the major sourcing bases is not a mystery, and it should never be accepted as an unevidenced percentage. Bangladesh makes the point. The ready-made garment (RMG) minimum wage was set at BDT 12,500 from 1 December 2023, a 56% jump from BDT 8,000, and the mandatory annual increment was raised from 5% to 9% after a December 2024 settlement, gazetted in January 2025. Wages there are reviewed every five years, so that 9% increment is a known, dated escalator running to the next review in 2028. A brand that knows this can model the labour-rate movement itself and check whether the supplier’s ask matches it, line by line.
Materials and energy: verify the index, not the adjective
Material movement is verifiable, and it should be demanded in that form. The World Bank’s April 2026 Commodity Markets Outlook recorded cotton prices rising 12% in April, reversing earlier softening, with the cotton stocks-to-use ratio projected to fall from 0.64 at the end of the 2025 to 2026 season to 0.59 a year later. Energy is the compounding variable for synthetics and for wet processing, and the same outlook projects energy prices climbing about 24% in 2026 to their highest level since 2022. A supplier citing “raw material increases” with no dated index reference and no mill quotation has handed the brand an adjective, not evidence.
The Cost-Increase Triage: Fund, Engineer, Or Challenge
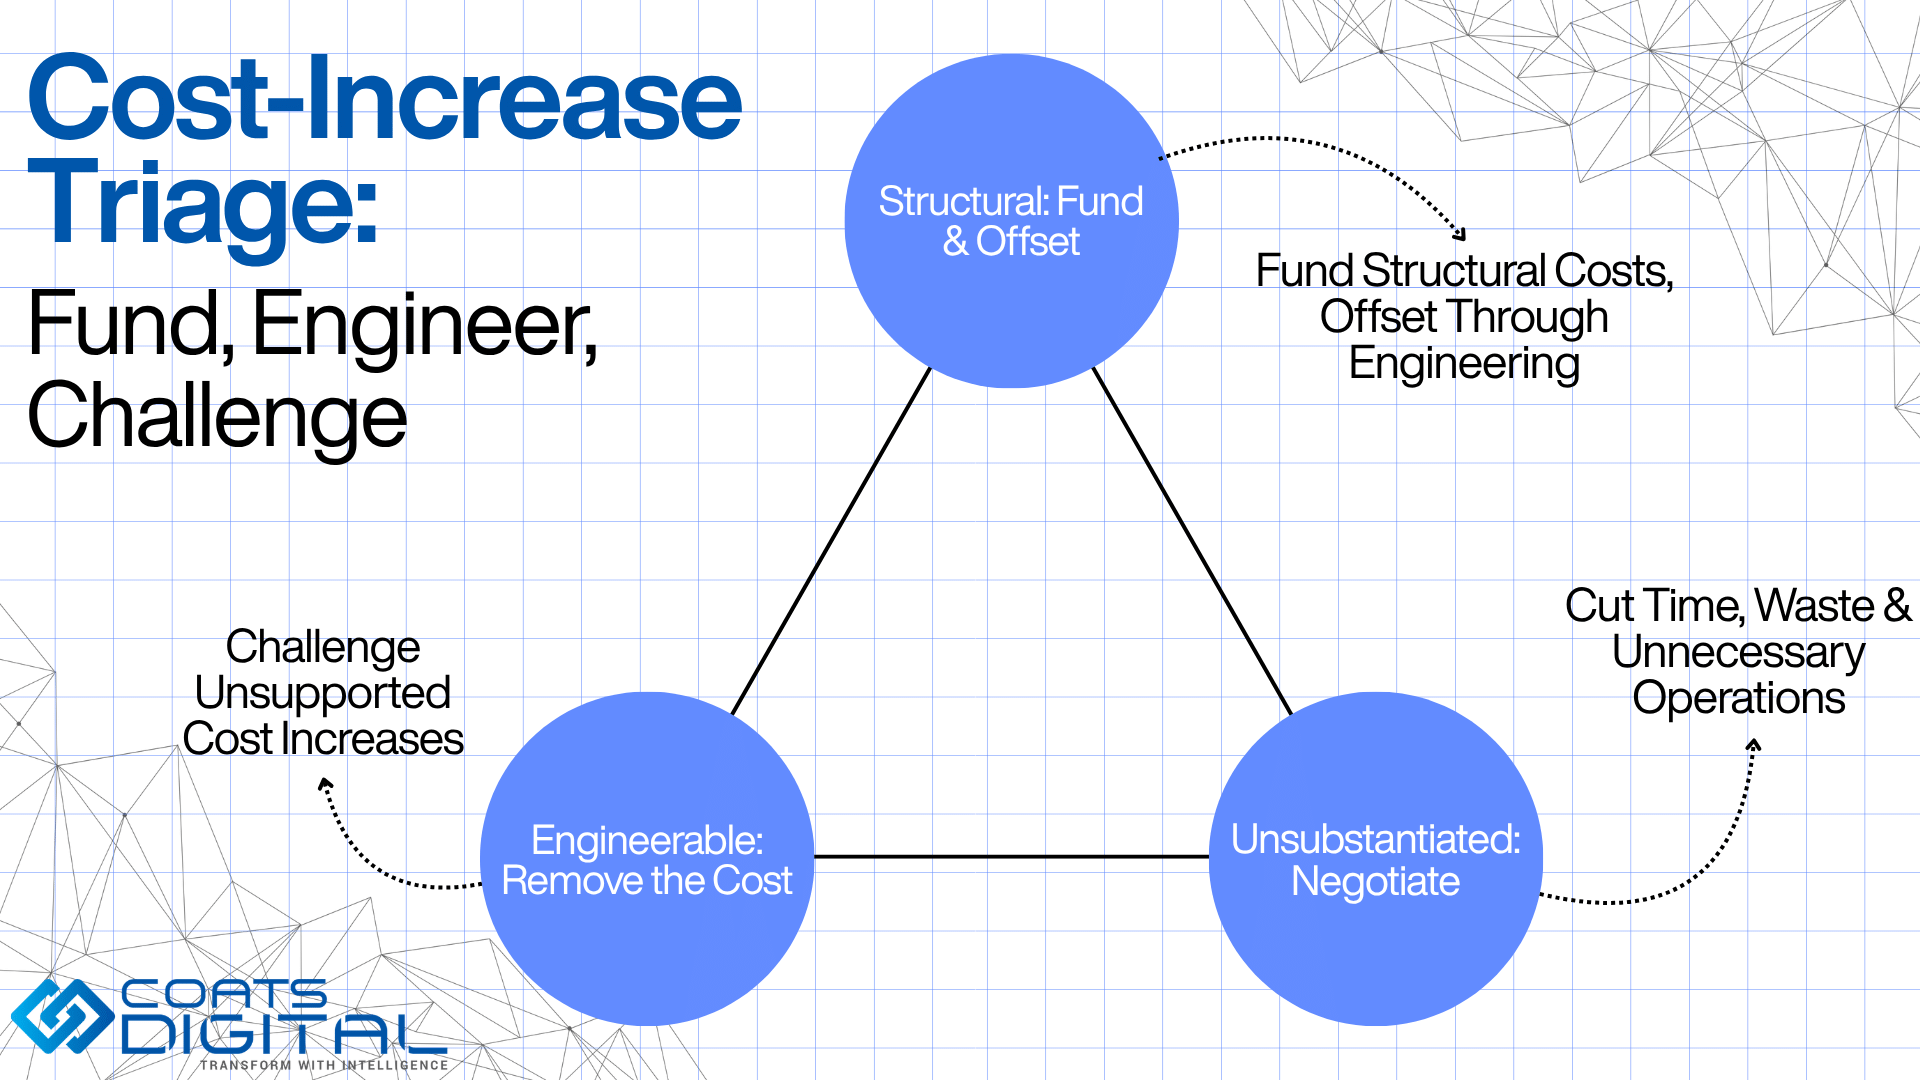
Every supplier cost increase divides into three buckets. Running the triage before you respond turns a single percentage into three separate conversations, each with a different owner. This is the part of the method a team can put to work immediately.
Structural costs are set outside the factory and evidenced. Fund them. Engineerable costs live inside the product and the process. Remove them; do not renegotiate them. Unsubstantiated costs are assertions with no method-level evidence. These, and only these, are a genuine negotiation.
Bucket one: structural. Fund it, then offset it
Statutory wage increments, verified index-linked material movements, fair living wage commitments, energy tariff changes and mandated compliance costs all belong here. Trying to negotiate these away is where responsible purchasing quietly fails. Fund the increase, then chase the offset separately through engineering. A brand that refuses to fund a legal wage rise is not protecting margin; it is booking a supply failure for two seasons’ time.
Bucket two: engineerable. Remove the cost, do not move it
Every unnecessary minute of work, every avoidable operation, every unbalanced line, every extra sampling round and every point of fabric wastage is cost that can come out of the product without anyone absorbing a loss. This is where most realisable margin sits, and it is the bucket most brands are least equipped to reach, because it needs operation-level visibility rather than commercial leverage.
Bucket three: unsubstantiated. This is the only real negotiation
A handful of signals mark an increase that has not been evidenced to method level:
- A single percentage applied uniformly across a whole style range, when the underlying cost drivers differ by construction.
- An efficiency assumption that has quietly slipped since the last costing round, with no matching change in capability.
- Operation times that do not correspond to the approved method or the operation bulletin.
- Overhead that scales with margin rather than with volume or machine hours.
- An increase that lands without a dated evidence pack, even after you have asked for one.
The table below maps a signal in the supplier’s request to the likely bucket and the correct first move.
| Signal in the request | Likely bucket | Correct first response |
| Dated gazette notification attached | Structural | Fund it; model the offset |
| “Raw material costs have increased” with no index | Unsubstantiated until evidenced | Ask for the index reference and mill quotation |
| Efficiency assumption dropped from 65% to 55% | Unsubstantiated | Ask what changed; compare against your own benchmark |
| Higher time on a newly complex operation | Engineerable | Review the method; test a simpler construction |
| Fair living wage gap calculation attached | Structural | Fund it explicitly and ring-fence it |
| Flat percentage across all styles | Mixed, needs decomposition | Refuse the aggregate; ask for it style by style |
In practice, an aggregate percentage rarely survives an operation-by-operation review intact. Once a flat 7% is examined style by style, it usually breaks apart into very different numbers, some fully justified and some with no method behind them at all. That decomposition is only available to a brand that holds its own view of what each style should take to make.
The Only Unit You Control Is The Minute
Cost-to-Make (CM) is time multiplied by rate. A brand has no real influence over the rate, which is set by wage law, contracted hours, energy prices and the factory’s cost base. It has considerable influence over the time, because time is a function of how the garment is built and how the line is run. Wage inflation, then, is not by itself a margin event. It becomes one only if the number of minutes stays fixed.
The relationship is exact. CM Cost equals total garment Standard Minute Value (SMV) multiplied by cost per minute. To hold CM flat against a cost-per-minute rise of x, the required SMV reduction is 1 minus (1 divided by (1 plus x)).
| Rise in cost per minute | SMV reduction needed to hold CM flat |
| 5% | 4.8% |
| 9% | 8.3% |
| 12% | 10.7% |
| 15% | 13.0% |
| 20% | 16.7% |
These are not aspirational figures. GSDCost, Coats Digital’s method-based costing solution, is documented to improve productivity by around 10%, and real implementations have gone well beyond that. Egyptian knitwear manufacturer DICE cut its core style SMV by 11% in the initial implementation phase and gained a 16% lift in production line efficiency. Nobland International and Indonesian lingerie manufacturer PT. Sumbiri each improved productivity by 13%, and Shanghai Jiale cut SMVs by over 30%. An 11% SMV reduction fully offsets a 12.4% rise in cost per minute. That is the whole margin defence in one line.
Why the offset needs an independent standard
A factory has no commercial reason to volunteer that a 12% time reduction is sitting inside the style it is quoting. The offset is only visible to a brand holding its own operation-level Bill of Labour (BOL) built on predetermined times. GSDCost uses 39 predetermined motion codes as building blocks to construct operations and product styles, which is what makes the resulting SMV comparable across factories and independent of any single line’s current performance. The method has to be pinned down first, because an ambiguous method produces an ambiguous time and therefore an unarguable cost.
Six Levers That Move The Number, Ranked By Yield And Speed
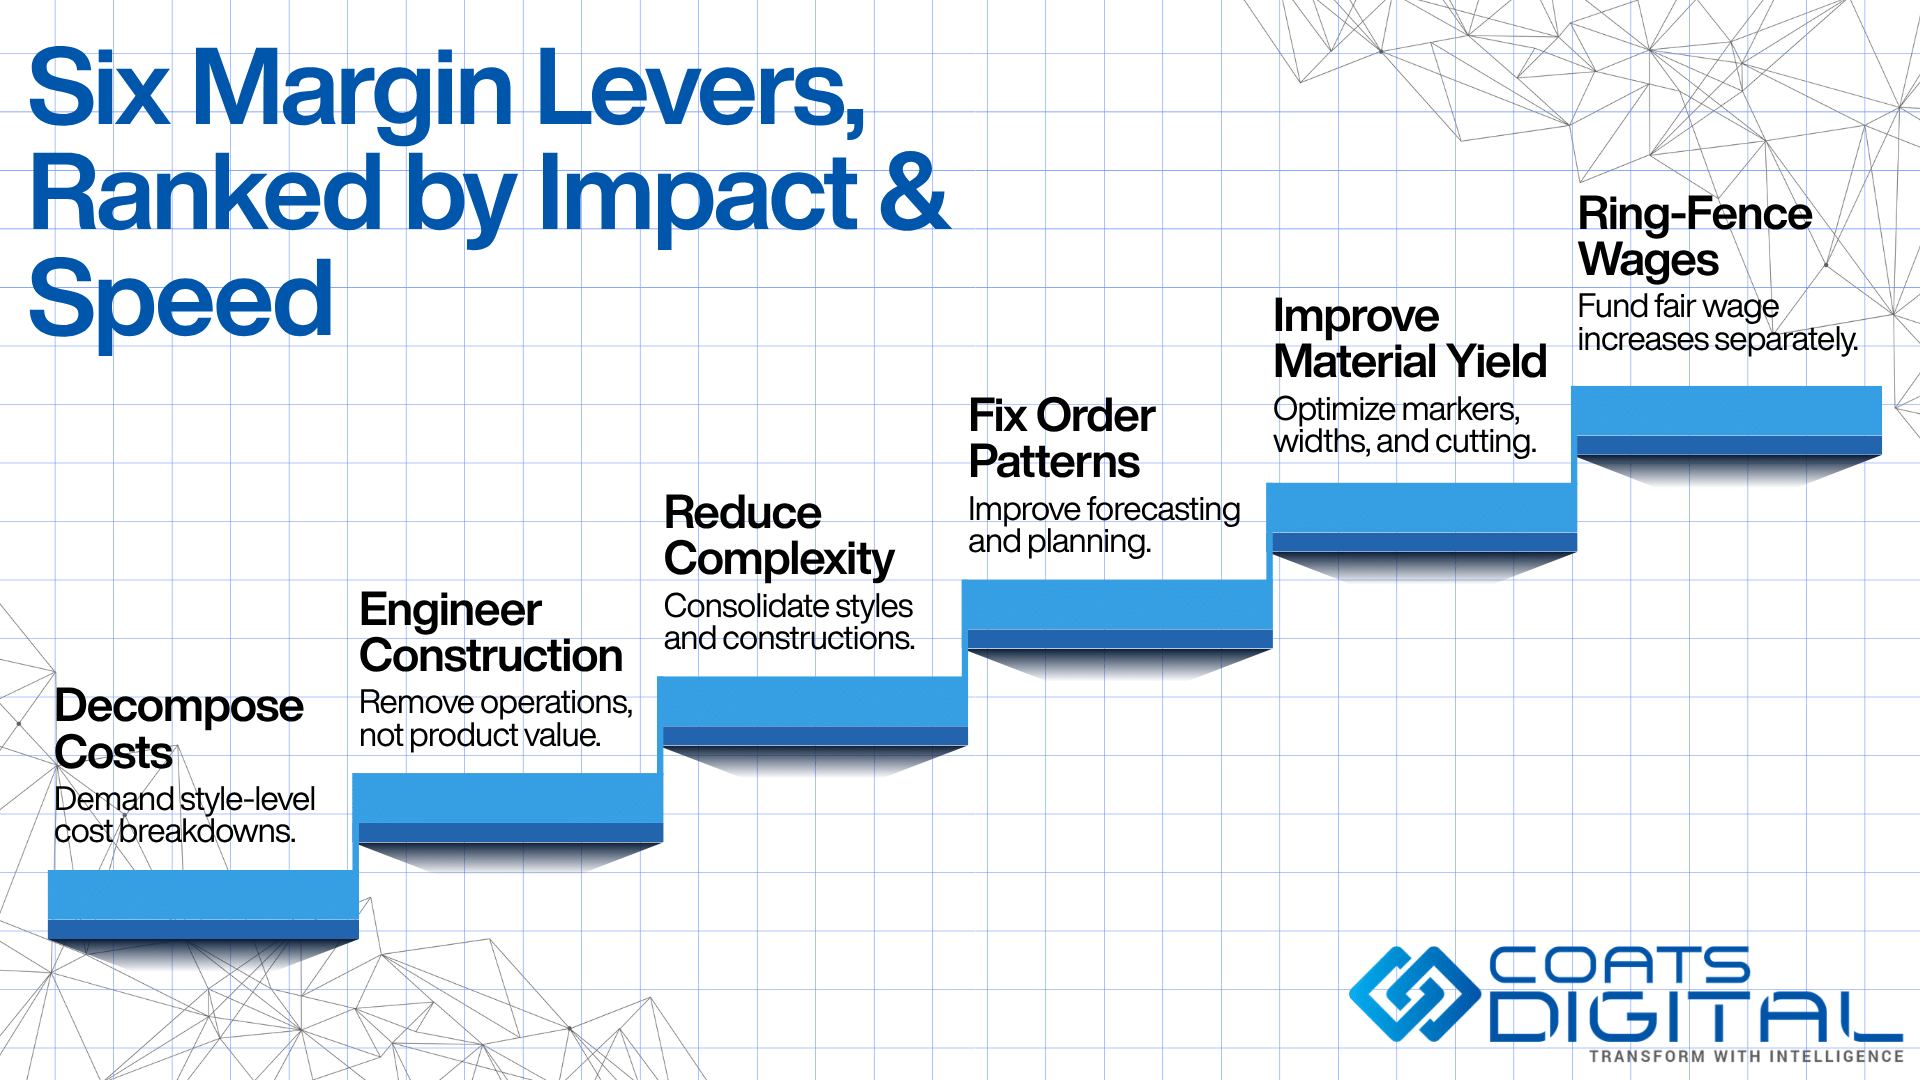
Each of these is specific enough to action now, and each carries its own limits. They run roughly from fastest to most structural.
- Decompose the increase before you respond: Refuse the aggregate percentage. Ask for a style-level, component-level breakdown with the efficiency assumption stated in writing, then run the triage above. The request for evidence does a lot of the work on its own, because it filters out increases that were speculative. Effect within one negotiation cycle.
- Value-engineer the construction, not the specification: Thinning the fabric or downgrading the trim is specification degradation, and the consumer notices. Removing an unnecessary operation, changing a seam type, combining two operations into one, or dropping an over-engineered finish that no shopper registers is construction engineering, and it takes out minutes without taking out value. Model the alternatives at the design stage, while change is still free. This is where costing early, rather than after a sample is cut, pays for itself.
- Attack complexity at the assortment level, not the style level: Range complexity is a labour cost multiplier that never appears on a single quote: short runs, frequent changeovers, extended learning curves, unamortised sampling. Consolidating a fragmented range onto fewer, better-engineered platform constructions lowers cost across every style at once. The industry is already moving this way. Levi Strauss has been streamlining its holiday assortment, and Tapestry cut handbag styles by more than 30% through 2025, both explicitly to strip out complexity under cost pressure.
- Fix the order pattern, because it is priced into every quote: Late tech packs, forecast volatility, split orders and last-minute changes all carry a cost that factories build into their rates whether or not they itemise it. The Cascale Better Buying Purchasing Practices Index 2025 assesses buyers across seven practice areas, including planning and forecasting, cost and cost negotiation, and payment and terms, and found that where buyers embedded fair lead times, predictable payment terms and coordinated communication, supplier outcomes held steady through tariff and geopolitical volatility. Forecast accuracy is a margin lever dressed up as an administrative one, and production planning tools such as FastReactPlan, documented to lift productivity by 5% to 10% without adding people or machines, exist to stabilise exactly this.
- Recover material yield, not just material price: Fabric is usually the largest single component of Free on Board (FOB) cost, and utilisation is where a brand can gain without asking anyone to accept less. Marker efficiency, width optimisation and consolidated cutting orders release cost that no negotiation can reach; fabric optimisation solutions such as FastReactFabric, which connect fabric buying and cutting in one platform, address this layer directly.
- Fund the wage line explicitly and ring-fence it: Separate the fair living wage allowance from the negotiable portion of CM so the two never compete. GSDCost includes a globalised Fair Wage Tool, drawing on Fair Wage Network data, that combines the international SMV for a style with factory efficiency, contracted hours and the agreed wage rate to let brands and manufacturers agree the wage allowance for any order in any factory and benchmark it against international fair wage standards. A ring-fenced wage line is not a concession. It is what stops wage cost becoming the accidental casualty of every cost-down round.
| Lever | Typical yield | Time to effect | Requires | Risk if done badly |
| 1. Decompose the increase | Removes the unsubstantiated portion | 1 cycle | Independent CM benchmark | Relationship friction if handled adversarially |
| 2. Value-engineer construction | High, compounding | 1 to 2 seasons | Method-level analysis at design stage | Specification degradation if confused with cost-cutting |
| 3. Reduce assortment complexity | High, portfolio-wide | 2 seasons | Merchandising alignment | Range narrowing beyond commercial tolerance |
| 4. Stabilise the order pattern | Moderate, invisible on quotes | 2 to 3 seasons | Planning discipline | None material |
| 5. Recover material yield | Moderate to high | 1 season | Cutting-room data | Quality risk if pushed past tolerance |
| 6. Ring-fence the wage line | Protective rather than additive | Immediate | Wage benchmarking data | Reputational and supply risk if ignored |
A worked example, illustrative only. A US homeware and accessories brand receives a 7% programme-wide increase. Decomposition shows 3.1 points from a documented statutory wage increment, 1.4 points from an evidenced fibre index movement, 1.5 points from an efficiency assumption cut with no explanation, and 1.0 point unallocated. The brand funds 4.5 points, challenges 2.5, and at the same time finds a 9% SMV reduction on its two highest-volume styles by removing a redundant edge-finishing operation. Net effect on CM across the programme is broadly flat.
Where The Margin Actually Leaks
A brand can win the CM negotiation and still lose the margin. CM is often only a modest share of FOB, so a hard-won 5% CM reduction may be worth roughly 1 to 1.5 points of FOB, while a single late shipment converted to air freight, or a season-end markdown caused by a delayed drop, can cost several times that. Most competing articles treat “cost increase” and “margin loss” as the same event. They are not, and any CFO recognises the difference on sight.
| Stage | What happens here | Typical driver | Controllable? |
| Agreed FOB | The negotiated number | CM, Bill of Materials, overhead, margin | Partially |
| Landed cost | Freight, duty, brokerage, handling | Trade policy, freight market | Rarely |
| Delivered-on-time cost | Air freight recovery, expedited handling | On-time delivery failure | Yes, upstream |
| Quality cost | Rework, seconds, returns | Method instability, rushed sampling | Yes, upstream |
| Realised gross margin | After markdown and promotional support | Late delivery, assortment misjudgement | Partly |
| Net margin | After returns and fulfilment | Category structure | Limited |
The leak most brands never cost is the sampling round. Each extra iteration burns factory capacity, engineering time and calendar. A compressed calendar forces rushed development, which forces more iterations, which compresses the calendar further. Costing at the design stage, before a sample is cut, is the intervention that breaks that loop, which is the whole case for generating an operation-level Bill of Labour early rather than late.
The False Economy Of Squeezing Suppliers
The commercial case against squeezing a factory is stronger than the ethical one, and it lands harder in a boardroom. A factory running below sustainable margin does not absorb the loss quietly. It moves its best lines to better-paying customers, defers maintenance, leans on overtime, sees turnover climb and lets quality drift. The brand experiences this as late delivery, higher defect rates and a slow decline in service, none of which gets traced back to the negotiation that caused it. The cost reappears, but on a different line of the profit and loss account and two seasons later.
That purchasing practice is a performance variable is now explicit, not a matter of goodwill. Cascale’s Better Buying analysis found that responsible purchasing produces measurable, sustained performance that directly affects supplier resilience. In June 2026, commenting on the new US forced-labour duties, Cascale warned that periods of financial pressure raise operational strain, with suppliers reporting greater difficulty around planning stability, cost absorption and order volatility, and a rising risk of excessive overtime and unauthorised subcontracting. Read as risk management rather than corporate social responsibility, the link is direct: brands with method-based costing can lower cost without squeezing, because they are removing work rather than removing margin.
The brands best placed to absorb a cost increase are usually the ones that already know, operation by operation, what the garment should take to make. Their negotiation is short because there is nothing to argue about. That, in the end, is the difference between a supplier relationship that survives a cost shock and one that quietly falls apart.
The Layer You Control And The Layer You Do Not: US Duty Policy In 2026
Some readers assume tariffs are the whole story. They are not, but they cannot be waved away either. Duty sits on top of the customs value as a separate landed-cost layer. It does not change the Cost-to-Make a brand should be paying, but it removes the headroom that used to absorb a poor CM negotiation.
Trade position verified 21 August 2026. US duty policy changed three times in five months and remains in active litigation. Re-verify against the USTR, US Customs and Border Protection (CBP) and the USITC Harmonised Tariff Schedule immediately before publication.
The 2026 sequence, briefly. The Supreme Court struck down the IEEPA reciprocal tariffs on 20 February 2026, leaving an estimated 166 billion US dollars in collected duties refundable. The administration replaced them the same day with a 10% Section 122 global import surcharge, effective 24 February 2026 for the statutory maximum of 150 days. The Court of International Trade ruled that surcharge unlawful on 7 May 2026 but limited relief to named plaintiffs, and the Federal Circuit stayed that injunction on 11 June 2026, so collection continued.
The Section 122 surcharge then expired by operation of law at 12:01 a.m. on 24 July 2026 and was replaced the same moment by new Section 301 forced-labour duties on 60 economies, covering roughly 99.4% of US imports. Those duties are 10% for economies judged to have, or to have committed to, forced-labour import prohibitions and 12.5% for the rest, with China and Vietnam at 12.5%. Goods entered duty-free under USMCA, and textile and apparel goods under CAFTA-DR, are exempt, as are goods already subject to Section 232 duties.
Apparel most-favoured-nation rates already average about 16.5%, among the highest in the US schedule, so most apparel from the major Asian bases now carries that base rate plus a 10% or 12.5% Section 301 layer, before any China-specific Section 301 duty or antidumping and countervailing duties. The new duties are themselves being litigated, with 25 states filing suit at the Court of International Trade on 3 August 2026, and a separate Section 301 investigation into manufacturing overcapacity remains open.
The practical takeaway is that the duty layer is both heavy and unstable, and it belongs to a different workstream. Classification review, first-sale valuation where a qualifying multi-tier sale exists, foreign trade zones and bonded warehousing, duty drawback on re-exports and tariff engineering are all legitimate tools, and all require professional trade counsel and accurate documentation. None of them changes what a garment should cost to make. Because the duty layer moves and lies largely outside a brand’s control, the ex-factory cost is where margin defence has to happen.
Build Versus Buy: What This Actually Requires
The credibility of any recommendation here depends on being willing to say when a tool is not needed. A brand with a narrow range, one or two long-standing vendors, and a costing lead who understands method analysis can run a defensible triage by hand. The framework is the valuable part. Tooling is what lets it survive scale.
Where it breaks is predictable. Manual should-cost models degrade across seasons, teams, and vendors. SMV assumptions drift, and nobody versions them. Building an operation-level Bill of Labour by hand is slow, and slowness is what stops brands doing it at the moment it matters most, which is before the design is frozen. The practical inflexion point is usually the fourth vendor or the fourth season, whichever arrives first.
A costing platform adds speed at the design stage, comparability across vendors, wage transparency and governance. GSDQuest, launched in August 2025, uses artificial intelligence to read a product image, tech pack or PDF, map the visible and hidden construction features to Coats Digital’s proprietary QED Library, and generate a fully detailed, standardised Bill of Labour in seconds. Crucially, it is built for brands, costing teams and sourcing professionals rather than only certified practitioners; as Coats Digital’s senior engineering director Jonathan McCormack put it at launch, it automates a process that has traditionally been manual and reserved for specialists.
On the sourcing side, GSDCost’s Costing Excellence functionality lets brands issue Bill-of-Labour-style requests to several vendors at once and compare Cost-to-Make responses in one place, using departmental SMV metrics across cutting, machining, inspection, pressing and packing to drill into discrepancies while accounting for differences in machinery and automation.
| Brand profile | Dominant margin risk | Practical approach |
| Emerging brand, 1 to 2 vendors, one costing lead | No independent view of what CM should be | Triage applied manually; one method-trained partner for a baseline SMV on core styles |
| Growing brand, 3 to 5 vendors, multi-season carryover | Assumption drift; too slow to cost before design freeze | AI-generated Bill of Labour at design stage; centralised, version-controlled BOL |
| Multi-category brand, 6+ vendors, several countries | Cross-vendor comparability; wage compliance; complexity cost | Method-based costing platform with multi-vendor comparison and fair-wage benchmarking |
A small brand may genuinely not need software. Saying so is what makes the recommendation for scaled brands credible.
Proving It Worked: The Margin-Defence Scorecard
The single most useful margin metric is the share of sourcing spend for which the brand holds an independent, method-based Cost-to-Make benchmark. The scorecard below gives a CFO and a VP of Sourcing something concrete to report against, and each line extracts cleanly for a board pack.
| Metric | What it tells you | Cadence |
| Share of spend covered by an independent SMV benchmark | Whether the brand can triage at all | Quarterly |
| CM variance against should-cost, by vendor | Where the unexplained cost sits | Per costing round |
| SMV drift on carryover styles, season on season | Whether times are creeping up unchallenged | Seasonal |
| Increases accepted with documentary evidence | Discipline of the triage process | Quarterly |
| Sampling rounds per style | Development cost and calendar health | Seasonal |
| Fabric utilisation against target | Material yield recovery | Monthly |
| On-time delivery performance | Leading indicator of markdown and air freight exposure | Monthly |
| Air freight as a share of total freight spend | Cost of upstream failure | Monthly |
| Fair living wage allowance funded, as a stated line | Wage cost protected from cost-down rounds | Per season |
Fund What Is Real, Remove What Is Not
The brands that hold margin through a cost increase are not the ones with the hardest negotiators. They are the ones that can say, operation by operation, which part of the increase is real, and that have already taken the equivalent number of minutes out of the product. The negotiation gets shorter, the relationship survives, and the margin holds.
With the duty layer unsettled and consumer pricing power limited, the ex-factory cost is the layer a brand can still act on, and acting on it means controlling method and time rather than applying pressure. The method is the value proposition. The tooling is only how the method scales. To see the documented SMV and productivity gains behind the figures above, or to put an independent view of what a garment should cost to make in place before the next increase lands, the Coats Digital team can walk a sourcing organisation through it.
Frequently Asked Questions
-
How do clothing brands protect profit margins when supplier costs rise?
By separating the increase into three parts before responding. Structural costs, such as statutory wage increments and evidenced material index movements, must be funded. Engineerable costs, meaning unnecessary operations, excess complexity and material wastage, should be removed from the product. Unsubstantiated costs, meaning increases with no method-level evidence, are the only genuine negotiation. Brands that apply this triage protect margin by removing work rather than by transferring cost onto the supplier.
-
Should I accept my supplier’s price increase?
Not as a single figure. Ask for it broken down by style and by cost component, with the efficiency assumption stated explicitly. Statutory wage changes and dated material index movements should be funded. Anything presented as a flat percentage across an entire programme should be refused in that form, because the underlying drivers differ by construction. The request for evidence itself resolves a significant share of speculative increases.
-
How much of a supplier price increase am I obliged to accept?
The portion that is set outside the factory and evidenced: statutory wage increments, verified fibre or energy index movements, mandated compliance costs and any agreed fair living wage allowance. You are not obliged to accept unexplained changes in efficiency assumptions, operation times inconsistent with the approved method, or overhead that scales with margin. Telling the two apart requires an independent, method-based view of what the garment should cost to make.
-
Can productivity gains offset wage increases?
Yes, and the arithmetic is precise. Cost-to-Make equals Standard Minute Value multiplied by cost per minute, so a rise in cost per minute is fully offset by a proportional cut in SMV. A 9% rise in cost per minute is offset by an 8.3% SMV reduction, and a 12% rise by 10.7%. Documented method-engineering implementations have delivered SMV reductions in the 5% to 13% range, which makes full or partial offset realistic rather than theoretical.
-
What is a should-cost model in apparel?
It is an independent estimate of what a garment ought to cost to make, built from the brand’s own inputs rather than the supplier’s quote. It combines a method-based labour estimate, meaning Standard Minute Value multiplied by an agreed cost per minute, with market material prices and reasonable overhead and margin assumptions. Brands use it to benchmark quotes, test the credibility of a price increase, and negotiate from data rather than instinct.
-
How can I reduce garment cost without changing suppliers?
Work on the product and the process, not the price. Remove or combine operations that add labour minutes without adding perceived value, simplify construction where the consumer will not notice, improve fabric utilisation, reduce assortment complexity so runs are longer and changeovers fewer, and stabilise the order pattern. Each of these takes cost out of the garment rather than moving it onto the factory’s margin.
-
What is the difference between cost reduction and cost transfer?
Cost reduction removes work, material or complexity, so the total cost of making the garment genuinely falls. Cost transfer simply shifts the same cost to another party, usually the supplier, through price pressure. Transferred cost tends to return as quality failures, late delivery, air freight recovery, and markdown exposure. Only cost reduction is durable, and it requires operation-level visibility rather than commercial leverage.
-
Why do factories raise prices mid-programme?
Legitimate reasons include statutory wage increments taking effect, energy tariff changes, and fibre or yarn movements that post-date the original quote, along with currency shifts and higher compliance costs. Less legitimate reasons include recovering losses on unrelated orders, or repricing after the brand’s own order pattern has become less predictable. The difference only becomes visible when the increase is broken down to component level with evidence attached.
-
How does complexity in a range affect production cost?
Complexity raises cost in ways that never show up on any single quote. More styles mean shorter runs, more changeovers, longer learning curves, more sampling rounds and more unamortised development. A factory prices that pattern into its rates whether or not it itemises it. Consolidating a fragmented range onto fewer engineered constructions lowers cost across every style at once, which is why complexity reduction usually beats style-by-style negotiation.
-
Is fair living wage cost negotiable?
It should not be treated as negotiable. Fair living wage cost is a legitimate upward driver, and squeezing it creates supply, reputational and regulatory risk that dwarfs the saving. The practical approach is to identify the wage allowance for a style explicitly, ring-fence it as a separate line so it never competes with cost-down targets, and find the offset through method and complexity reduction instead.
-
How do I know whether a factory’s efficiency assumption is honest?
Compare it against the factory’s own historical performance, against your independent SMV for the style, and against comparable vendors running similar constructions. A suppressed efficiency figure inflates Cost-to-Make without changing anything physical, which makes it one of the most common and least visible sources of margin leakage. Ask what changed operationally to justify a lower figure, and expect a specific answer.
-
What is effective cost per minute and why does it matter?
Effective cost per minute is the quoted rate divided by factory efficiency, and it frequently reverses the apparent ranking of two quotes. A factory quoting a low headline rate at low efficiency can cost more per garment than one quoting a higher rate at high efficiency. Comparing headline rates alone will therefore often select the more expensive vendor, and will also miss capability differences that carry real value.
-
Do tariffs change what I should pay my factory?
No. Duty is applied to the customs value as a separate landed-cost layer and does not alter the Cost-to-Make a brand should be paying. What tariffs change is the headroom, because with an elevated and volatile duty layer there is far less margin available to absorb an inflated Cost-to-Make. Tariff mitigation belongs to a customs and trade-compliance workstream, not to the costing conversation.
-
How can US brands offset tariff costs without raising retail prices?
Only partly, and mostly upstream. The controllable layer is the ex-factory cost, addressed through method engineering, complexity reduction, material yield and order-pattern stability. Separately, and through trade counsel rather than sourcing, brands can review classification, examine first-sale valuation where a qualifying multi-tier sale exists, use foreign trade zones or bonded warehousing for deferral, and claim duty drawback on re-exports. These are compliance disciplines that require accurate documentation.
-
Is moving production to a cheaper country a good way to protect margin?
Sometimes, but less often than assumed, and the wider industry has been consolidating rather than diversifying through 2026. Transition carries real costs: vendor learning curves, additional sampling, quality ramp, longer or less reliable lead times, and the loss of accumulated method knowledge. A move made to escape a modest increase can be more than swallowed by first-season inefficiency. Model the full landed cost and the transition period before committing, and compare it against what method engineering could deliver with the incumbent.
-
What is a Bill of Labour and why does it help in a cost negotiation?
A Bill of Labour is an operation-level breakdown of every cutting, sewing and finishing step in a style, each carrying a Standard Minute Value. Where the Bill of Materials covers what a garment is made from, the Bill of Labour covers what it takes to make. In a negotiation, it turns an argument about a percentage into a review of specific operations, which is a conversation the evidence can actually settle.
-
How does GSDCost help brands protect margin when costs rise?
GSDCost establishes method-based Standard Minute Values using 39 predetermined motion codes, giving brands an independent view of what a style should take to make. That benchmark supports three things: testing whether a proposed increase is consistent with the method, finding where minutes can be removed to offset an unavoidable rate rise, and comparing Cost-to-Make responses across vendors on identical terms. A built-in Fair Wage Tool, using Fair Wage Network data, keeps the wage allowance visible and separate.
-
Do small brands need costing software to manage supplier cost increases?
Not necessarily. A brand with a narrow range and one or two long-standing vendors can apply the triage manually, using a structured cost sheet and a method-trained partner to establish a baseline on core styles. The constraint is governance and speed rather than capability. Most brands reach the point where a platform pays for itself around the fourth vendor, or when the cost of assumption drift starts to exceed the cost of the tooling.

How Bangladesh Knitwear Factories Improve Operator Efficiency Across Sewing, Linking and Finishing

Best Lean Manufacturing Software for the Indian Garment Industry

Brand-to-Vendor Cost Collaboration: Which Layer of the Cost Stack Are You Missing?
All Blog Categories
- Production Planning
- Corporate
- Method Time Cost Optimisation
- Supply Chain Solutions
- Sustainability
- Videos