How Bangladesh Knitwear Factories Improve Operator Efficiency Across Sewing, Linking and Finishing
by Kunal Kapur
 9
Mins Read
- Key Takeaways
- The Quote Arrives as a Single Number
- Why a Supplier Quote Is Never Just a Price
- Why “just send me a breakdown” is not enough
- What “Accurate” Actually Means
- Why labour is the variable that decides the quote
- The Independent Anchor: Standard Minute Value
- SMV and SAM: same measure, different label
- Predetermined motion time systems vs stopwatch time study
- Building the Cost Breakdown Before You Order
- Reading the Gap Between Your Number and Theirs
- When a higher quote is the better deal
- Separating fair-wage cost from inflation
- Red flags in a supplier breakdown
- Comparing Breakdowns Fairly Across Multiple Suppliers
- Issue one Bill of Labour and lock the SMVs
- Build vs Buy: Do You Need Software for This?
- What a spreadsheet and a trained partner can do
- What breaks at scale
- What a costing platform adds
- Walk In With Your Own Number
- Frequently Asked Questions
Key Takeaways
- A knit factory earns a fixed Cost of Make and keeps only the minutes it does not waste, so operator efficiency is its real margin lever.
- Cut-and-sew jersey runs sewing lines; fully-fashioned sweaters run linking. Finishing is common to both, and each route must be measured separately.
- A blended line-efficiency figure can read 55 per cent while one operator runs at 85 and another at 35. Measure operation by operation in standard minutes.
- In sweaters, linking is usually the hidden bottleneck: slow, manual, gauge-dependent and skill-intensive, yet rarely measured with the rigour sewing gets.
- Most low efficiency is a method problem, not an effort problem. Lost minutes come from layout, wasted motion and imbalance, not slow hands.
- Standard Minute Value (SMV) is the common unit that lets an IE team compare operations, balance the line, set fair incentives and see where minutes leak.
- The gap that quietly kills efficiency is standard method versus actual floor method. Closing and sustaining it turns a one-off gain into a durable one.
Why Operator Efficiency Is The Margin In Bangladesh Knitwear
Every industrial engineering (IE) head in a Bangladesh knit factory knows the month-end feeling. The line-efficiency board on the floor looked fine all month, yet the costing sheet says the programme barely broke even.
That gap between what the board shows and what the P&L records is almost always operator efficiency. It is also the most reliable margin a factory can recover without winning a single new order.
The pressure behind that gap is structural. Bangladesh is the world’s second-largest apparel exporter after China, and cotton knitwear alone drives a little over half of ready-made garment (RMG) export value (BGMEA and WTO trade data). The sector runs across more than 4,000 export-oriented factories employing around 4.4 million workers, most of them women (ILO).
But it competes at the value end of the market, where there is almost no room for cost error, and the cost base is climbing. The entry-level minimum wage rose 56 per cent in December 2023, from 8,000 to 12,500 taka, and from December 2024 the annual increment was lifted to a combined 9 per cent a year.
Buyer FOB prices have not moved to match, and RMG export earnings actually slipped slightly in the first half of 2026 on weaker demand. When the price is fixed and the wage bill rises, the only lever left is the minute.
Here is the point that reframes the whole topic. A knit factory is not paid for pieces; it is paid a Cost of Make (CM). It keeps only the difference between the minutes it was costed for and the minutes it actually burns. That difference is operator efficiency.
Lift it and margin appears from the same building, the same lines and the same order book. What follows is a knitwear-specific, method-first guide to raising it across the two knit assembly routes, sewing for cut-and-sew and linking for sweaters, and their shared finishing.
What Operator Efficiency Actually Means In A Knitwear Factory
Operator efficiency is the standard time earned by what an operator produced, divided by the time that operator was available to work, expressed as a percentage. In plain terms, it weighs the minutes the work should have taken, its Standard Minute Value (SMV), against the minutes the operator was paid to be present.
The formulae, stated once
Operator efficiency (%) = (Units produced × SMV) ÷ Available minutes × 100
Line efficiency (%) = (Line output × Garment SMV) ÷ (Operators × Working minutes) × 100
Two operators producing the same number of pieces can post very different efficiency if their operations carry different SMVs. That single fact is why measurement has to sit at the level of the operation, not the line.
Three terms the floor tends to conflate
- Operator efficiency is one person on one operation, measured against the time they were available, which includes waiting and downtime.
- Line efficiency is the whole line, an average across every operation. A healthy average can sit comfortably over an operation that is quietly far from standard.
- On-standard performance measures how the operator works only during the time actually spent working, stripping out waiting and downtime. It separates a method problem from a feeding-and-balance problem.
SMV and SAM, defined properly
SMV is the time a qualified operator at standard performance takes to complete an operation by a defined method, including allowances. Standard Allowed Minute (SAM) means the same thing; most factories use them interchangeably, though some keep SAM for planning and SMV for costing.
The discipline that matters is fixing one definition before you calculate anything, so numbers stay comparable across lines and seasons. Coats Digital sets out the mechanics in its guide to defining standard time:
Basic Time = Observed Time × Performance Rating
SMV = Basic Time + Allowances (typically a bundle allowance plus around 15 to 20 per cent for machine and personal needs; factories set their own allowance tables)
Locate your own floor on a realistic scale before going further. Bangladesh knit factories commonly run in the region of 50 to 60 per cent line efficiency; a genuinely good level is often cited around 60 to 70 per cent, with best-in-class above 80 per cent. Treat these as sourced industry ranges rather than fixed law, because the right figure varies by style, line and factory.
Two Ways Knitwear Is Assembled, And Why One Number Hides The Truth

Most factories report one sewing-floor figure and manage to it. In knitwear that average misleads, for two reasons.
First, knitwear is not assembled one way: cut-and-sew jersey and fully-fashioned sweaters use fundamentally different operations. Second, whichever route you run, the garment passes through operations that are not alike in speed, skill, measurability or failure mode.
Improving the average means knowing which operation is dragging it down, and that means measuring each one separately, in standard minutes.
The cut-and-sew route (jersey knits)
For T-shirts, polos and activewear, circular-knitted fabric is cut and then sewn on overlock, flatlock, coverstitch and bartack machines in a progressive line. This is the best-understood knit operation, with the most mature SMV data and line-balancing practice.
The usual leak is imbalance: one workstation carries far more work content than its neighbours, so the line paces to its slowest operation, the bottleneck, while others sit idle and work in progress (WIP) piles up in front of the constraint.
The fully-fashioned route (sweaters), where linking is the hidden bottleneck
Sweater panels are knitted to shape on flat-knit machines, then joined by linking, not sewing. Linking joins shoulders, collars, cuffs and sleeves stitch by stitch on a dial or circular machine, picking up both fabric edges loop by loop so the seam lies flat and nearly invisible.
It is inherently slow. It needs an operator who has trained for months to reach speed and accuracy, and the machine needs a fresh setup whenever the gauge, the fineness of the fabric, changes.
Academic and industry sources consistently describe linking as the most labour-intensive and skill-dependent stage of sweater construction, a quality marker and a bottleneck at once. Because it is manual, variable and hard to time, many factories measure it loosely, or bury it in a blended number, and never see that it, not sewing, is what caps sweater output.
Finishing, shared by both routes
Finishing in knitwear is heavier and more manual than in woven. It runs from trimming and mending, the hand-repair of defects with needle and yarn, through washing and drying, pressing or boarding, then labelling, folding, metal detection, inspection and packing.
It is labour-intensive, quality-dependent and highly variable order to order, so a line balanced for a plain style can collapse on a heavily embellished one. Rework loops, re-mending and re-pressing, quietly consume standard minutes that never show up as production.
| Production model | Assembly operation | Why efficiency leaks | Common measurement gap |
| Cut-and-sew (jersey) | Sewing on overlock, flatlock, coverstitch, bartack | Line imbalance; the bottleneck paces the whole line; WIP build-up | Managed to a line average that hides the constraint operation |
| Fully-fashioned (sweater) | Linking, stitch by stitch on a dial or circular machine | Slow, skill-intensive, gauge-dependent setup; long learning curve | Rarely timed operation by operation; often the unseen cap on output |
| Both routes | Finishing: trim, mend, wash, press, inspect, pack | Manual and variable by style; rework and re-pressing loops | Rework minutes not counted; balance breaks on complex styles |
Why Most Low Efficiency Is A Method Problem, Not An Effort Problem
The instinct is to push the operator; the leverage is in the method
When output falls short, the reflex is faster hands, longer hours, more pressure. But the largest, most repeatable gains sit in the method: how the workplace is laid out, how far the operator reaches, how the bundle is handled, how many non-value-adding (NVA) motions live inside each cycle, and whether the line is balanced.
An operator working flat out with a poor method still loses minutes on every piece. Fix the method once, and every piece is faster, permanently, without extra strain.
Why the measurement method matters as much as what you measure
A stopwatch time study captures whatever the operator does today, good method or bad, and bakes that waste into tomorrow’s standard. A Predetermined Motion Time System (PMTS) works differently.
It breaks an operation into standard elemental motions, get, put, position, align, sew, each with a predetermined time, so an engineer can see and cost the method itself before a garment is made, and engineer out the wasted motion rather than merely recording it. GSD (General Sewing Data) is the PMTS built specifically for apparel, and it is the basis of Coats Digital’s GSDCost method-time-cost standard.
Two further factors decide knitwear efficiency in practice. The skill matrix matters because the same operator can be strong at collar attachment yet weak at sleeve setting, so matching operator to operation changes output directly. And the learning curve matters because sweater production is seasonal and style-heavy, so every changeover restarts a climb back to standard that clear operation bulletins and a good method shorten.
Myth versus reality
| Myth | Reality |
| Efficiency rises when operators work faster. | It rises when the method removes the wasted motion inside every cycle. |
| The standard is whatever the stopwatch recorded. | A stopwatch can lock today’s poor method into the target; PMTS lets you set the standard for the best method. |
| A balanced-looking line is a balanced line. | Without operation-level SMV, the bottleneck is built into the plan and hidden by the average. |
| New styles are just slow at first. | The learning-curve loss is real and largely engineerable through clear methods and operator-skill matching. |
What Poor Operator Efficiency Actually Costs A Knitwear Factory
The direct margin cost
The factory is costed on standard minutes but pays for actual minutes. Every point of efficiency below the costed level is Cost of Make it will never recover: more operators per garment, more overtime, a CM margin that thins or disappears.
On value-end knit basics, where labour is a large share of the cost the factory controls, a persistent efficiency gap is the line between a profitable programme and a loss-making one.
The knock-on and relationship cost
Low efficiency does not stay on the floor. It forces reactive overtime, which lifts cost and fatigues operators, dragging efficiency down further. It slips ship dates and dents On-Time Delivery Performance (OTDP), inviting buyer penalties and weaker scorecards.
And absenteeism compounds it: when attendance swings day to day, planned capacity and realised output diverge, one of the documented reasons regional line efficiency stalls. In a market where buyers can shift volume to Vietnam or elsewhere, a reputation for missing dates costs far more than any single order.
| Cost dimension | What it looks like |
| Margin | More labour minutes than costed; CM margin erodes garment by garment |
| Overtime | Reactive overtime to hit targets, at higher cost and rising fatigue |
| Delivery | Slipping ship dates, weaker OTDP, buyer penalties and chargebacks |
| Attendance | Absenteeism widens the gap between planned capacity and actual output |
| Quality | Rework and mending loops that consume minutes and hide as “not produced” |
| Commercial | Weaker scorecards and buyer confidence; volume at risk to competitors |
The cost of low operator efficiency is rarely one number on a report. It is the compounding of thin margin, overtime, absenteeism, rework and delivery risk, all traceable to minutes lost to a fixable method.
How To Improve Operator Efficiency: A Seven-Step Method
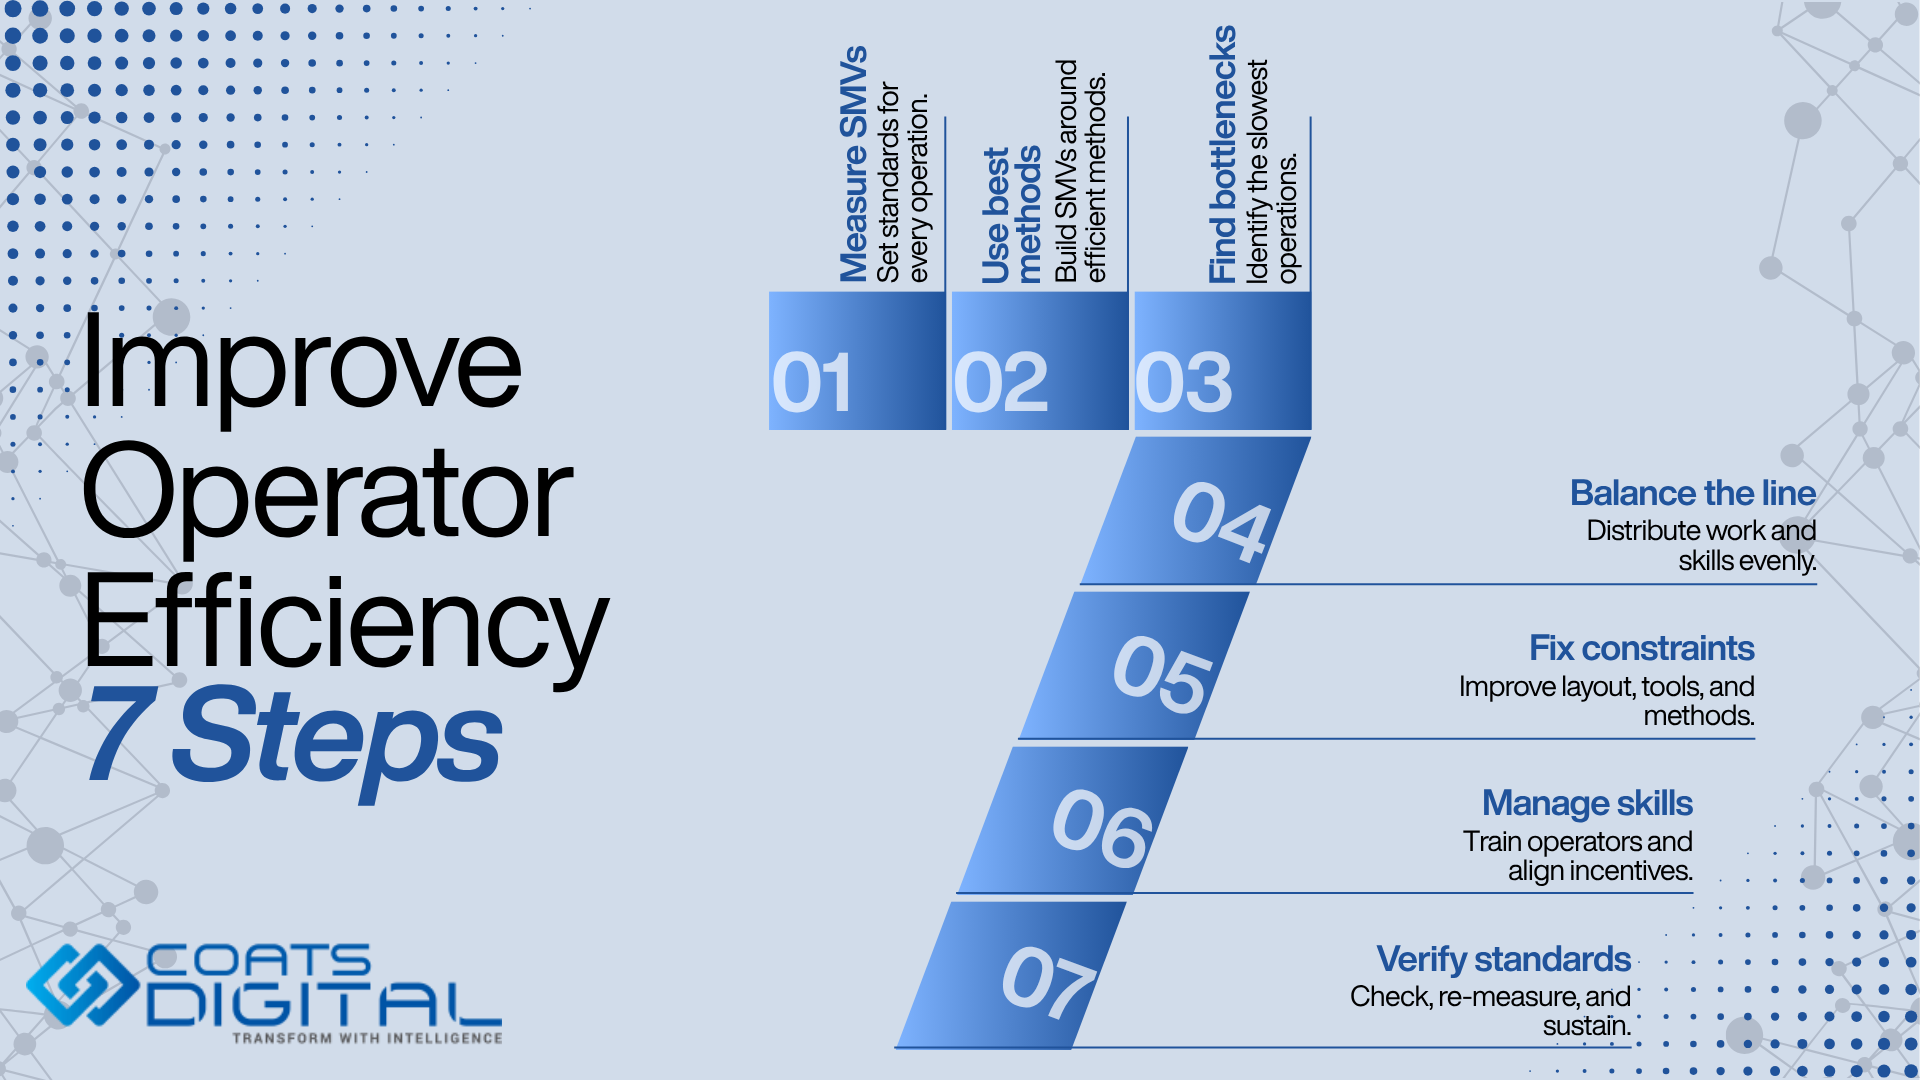
- Measure every operation in standard minutes. Build or refresh the operation bulletin for each style so every operation, sewing, linking or finishing, carries an SMV. You cannot balance, target or fairly incentivise what is tracked only as a line average. Coats Digital’s practitioners set out the mechanics in its guide to calculating SMV.
- Set the standard to the best method, not the current one. Establish SMVs from a defined, efficient method (this is where a PMTS such as GSD is decisive) rather than timing and freezing whatever the floor does today. The standard should describe how the operation should be done, not merely what it currently is.
- Find the true bottleneck. Use per-operation capacity (pitch) to locate the operation with the longest cycle time. On sweater lines, check linking honestly; it is frequently the constraint the blended number conceals.
- Balance the line against operation SMV. Redistribute work content so stations carry roughly equal load, move tasks between operator and helper, and match operators to operations using the skill matrix. Balancing cuts idle time and lifts output from the same headcount.
- Engineer the method on the bottleneck first. Attack the constraint: improve workplace layout and reach, cut material handling, remove NVA motions, add the right attachment or folder, and standardise the linking setup routine. Then re-balance, because the bottleneck will move.
- Manage skill, incentives and the learning curve deliberately. Use clear operation bulletins and targeted training so each style change climbs back to standard faster, deploy skilled operators onto the highest-work-content and longest-learning operations, and tie incentives to accurate, consistent SMVs so they reward genuine performance, not a soft standard.
- Verify standard versus actual, then re-measure and sustain. Check that the method operators actually run matches the standard the SMV was built from, the single most common reason gains evaporate, correct the drift, and re-measure on a rolling basis as styles and lines change.
Worked mini-example (figures illustrative, to show the method)
A sweater line reports 55 per cent line efficiency and misses target. The blended number suggests a general “slow line.” Operation-level measurement tells a different story: sewing and finishing sit near standard, while the shoulder-and-collar linking operation carries roughly double the pitch of every other station. Linking is the bottleneck, and the average was hiding it.
The fix is not to push the whole line. It is to shift non-linking sub-tasks off the linking station, add a second linking machine for that operation, standardise the gauge-changeover routine to cut setup, and match the strongest linkers to it. Line efficiency lifts because the constraint, not the “whole line,” was fixed.
A Sewing, Linking And Finishing Playbook
The method above is common to every operation; the levers are not. Below are the highest-return moves for each, on the understanding that the first job is always to measure the operation in standard minutes so you know which lever to pull.
Sewing lines (cut-and-sew knits)
- Balance to operation SMV and re-check with a capacity study at a set interval, not once at line setting.
- Reduce NVA motion at the workstation: cut reach distance, position trims and bundles within easy grasp, use the correct folders, guides and attachments.
- Attack changeover loss between styles with a standardised setup routine and pre-kitting.
- Match operators to operations with a live skill matrix; put your strongest operators on the highest-work-content operations.
Linking lines (sweaters)
- Treat linking as its own measured operation with its own SMV, not a line afterthought.
- Standardise the gauge-changeover procedure to shrink setup time, the productivity killer unique to linking.
- Invest in operator skill deliberately: linking speed and accuracy take months to build, so structured training and retention are efficiency measures, not HR niceties.
- Protect the operation’s conditions (lighting, ergonomics, seating), because eyestrain and fatigue directly slow a stitch-by-stitch manual operation.
- Where volume justifies it, appraise higher-speed or semi-automatic linking equipment against the measured bottleneck. Treat it as an option to evaluate, not a default, since manual linking still dominates the sector.
Finishing lines
- Count rework: measure mending and re-pressing loops as standard minutes so hidden losses become visible.
- Re-balance finishing per style, not once per season, because embellishment and construction shift the work content sharply.
- Push quality upstream, fewer defects at sewing and linking, so finishing spends less time mending; it is the fastest way to free finishing capacity.
- Standardise pressing, boarding and packing methods and workplace layout the same way you do for sewing.
Cross-cutting lever: incentives. An SMV-based incentive scheme rewards operators for beating a fair, accurate standard. Built on inconsistent or stopwatch-frozen SMVs, the same scheme quietly pays for a flawed target. The standard has to be trustworthy before the incentive is.
The Metrics That Matter, And How To Read Them
Improvement you cannot see does not survive the next style change. The aim is not more dashboards but the right few, measured at operation level, so the blended average can never again hide a constraint.
Hold on to one distinction: efficiency is measured against available time, including waiting and downtime; on-standard performance is measured against time actually worked.
| Metric | What it tells the IE team | Why it matters for knitwear |
| Operator efficiency (%) | Standard minutes earned versus minutes available, per operator | The base unit; exposes who and which operation is off standard |
| Line efficiency (%) | The same ratio across the whole line | Useful only alongside operation-level data, never instead of it |
| On-standard performance (%) | Performance during time actually worked | Separates “poor method” from “too much waiting and downtime” |
| Off-standard / non-productive time | Minutes lost to waiting, breakdowns, changeover | Often the real story behind a low efficiency figure |
| Capacity utilisation (%) | Output versus available capacity in standard minutes | Links efficiency to the order book and planning |
| DHU and Right First Time | Quality at source | Falling quality quietly creates finishing rework and hidden minute loss |
| Tier | Typical line efficiency | Note |
| Struggling | Below 45 per cent | Often imbalance, absenteeism and an unmeasured bottleneck |
| Typical (Bangladesh) | 50 to 60 per cent | The band most factories sit in |
| Good | 60 to 70 per cent | Disciplined measurement and balancing |
| Best-in-class | 80 per cent and above | Rare, sustained method and skill maturity |
Present as sourced industry ranges, not fixed law. On the machine-utilisation view, garment Overall Equipment Effectiveness (OEE) commonly sits at 40 to 60 per cent against a world-class benchmark of around 85 per cent.
Reading the numbers
- Low efficiency with high on-standard performance means the operator works well but waits too much; fix feeding, balance and downtime.
- Low efficiency with low on-standard performance points to method or skill; engineer the method and match the operator to the operation.
- A healthy line average sitting over an unmeasured linking or finishing operation is a false positive; measure the operation.
From Stopwatch To A Method Standard: Pmts, Ai And Software
Manual time study plus Excel can start a factory on the path, but it carries three structural weaknesses for knitwear. It captures and freezes today’s method, waste included. It is applied inconsistently, so the same operation earns different SMVs across lines and seasons. And it leaves no shared, maintainable method standard when styles change constantly.
A method-time-cost system adds a scientific, repeatable standard: operations built from predetermined motion times, one SMV language across sewing, linking and finishing, method analysis that lets engineers improve an operation rather than only record it, and the operation bulletins that make line balancing, capacity planning and incentives reliable.
GSDCost is widely regarded as the apparel industry’s de facto international standard for method-time-cost benchmarks. It is a Software-as-a-Service solution built on GSD, whose predetermined time-motion database uses 39 motion codes as building blocks to model thousands of operations, features and styles.
Licensed practitioners use it to perform scientific method analysis and create a consistent method standard. It ships pre-built global data libraries for product types including jersey knit and athleisure, directly relevant to cut-and-sew units, and works across cutting, machining, inspection, pressing and packing, so both sewing and finishing are covered. Coats Digital reports GSDCost has proven to improve productivity by around 10 per cent.
Two AI-era tools extend the same argument rather than replacing it:
- GSDQuest generates a standardised Bill of Labour from a product image, tech pack or PDF in seconds, using the QED Library, accelerating analysis and opening costing up beyond certified practitioners.
- GSD RealMotion, launched in August 2026, uses AI and computer vision to turn shop-floor video into GSD-coded method studies in minutes, turning a 45-minute manual timing into a 15-minute video-assisted study. It classifies every motion as value-adding, necessary or non-value-adding, and verifies that the method an SMV is built from matches what operators actually run on the floor. It is the tool that operationalises Step 7 above: engineers spend their time improving the method, not measuring it.
Where software stops and judgement starts
Software sets and sustains the standard; it does not run the floor. A method standard tells you the best way to perform an operation, but a supervisor still has to train to it, an IE still has to choose which bottleneck to attack first, and a planner still has to decide which styles run on which lines.
The technology removes the guesswork from measurement and frees engineering hours; the operational calls, and the discipline to keep the floor running the agreed method, remain human.
Efficiency and planning are two halves of the same problem
Accurate SMVs only pay off if they feed the plan. A line balanced to the right standard still misses ship dates if capacity, materials and the critical path are planned on guesswork.
This is where a production-planning layer such as FastReactPlan turns SMV data into realistic capacity and schedules. The link is visible in knitwear: SQ Celsius, a knitwear specialist, reported a 6 per cent improvement in production efficiency, an 8 per cent rise in OTDP and a 7 per cent cut in overtime after adopting FastReactPlan. Standards and planning are two halves of the same margin problem, which is why Coats Digital positions them within one connected manufacturing solution suite.
Verified customer outcomes
Lead with the Bangladesh knit proof point. Cotton Club (BD), a Bangladesh composite knit manufacturer, reduced core-style production time by 25.6 per cent, lifted productivity by around 5 per cent and improved OTDP by around 7 per cent after adopting GSDCost.
Supporting knit and line-balancing evidence comes from other markets.
DICE, an Egyptian knitwear manufacturer, cut its core-style SMV by 11 per cent and gained a 16 per cent rise in production line efficiencies during its GSDCost trial; Üniteks, a Turkish knitwear manufacturer, adopted GSDCost specifically to streamline line balancing and optimise previously idle capacity; and Humana Apparels, a Bangladesh manufacturer, reported productivity up around 15 per cent and on-time delivery up around 10 per cent. Every figure here is attributed to its named source.
| Factory tier | Typical profile | Recommended starting point |
| Small unit | Single site, few lines, moving off Excel and stopwatch | Standardise operation bulletins in SMV; apply consistent allowances and disciplined line balancing before adding software |
| Mid-size knit exporter | Multiple lines, multiple buyers, wage and OTDP pressure | A method-time-cost standard (GSDCost) to fix SMV consistency, engineer method and balance lines across sewing, linking and finishing |
| Large / multi-factory group | Many lines and units, seasonal sweater programmes | Method-time-cost standard plus AI-assisted analysis (GSDQuest), standard-versus-actual verification (GSD RealMotion) and connected planning |
Six Common Operator-Efficiency Mistakes: A Self-Diagnostic
- Managing to one blended line efficiency and never measuring sewing, linking and finishing separately, so the real constraint stays invisible.
- Ignoring linking as a measured operation, then wondering why sweater output is capped despite a healthy line number.
- Treating low efficiency as an effort problem and reaching for overtime and pressure, when the fixable loss is in method and balance.
- Building SMVs from a stopwatch on today’s method and freezing the waste into the standard, then costing, targeting and incentivising against it.
- Applying SMV and allowances inconsistently across lines and seasons, so no two numbers are comparable and improvement cannot be tracked.
- Setting the standard once and never checking whether operators actually run that method on the floor, so gains quietly drift away within a season.
Engineer The Minute, Do Not Chase The Operator
Raising operator efficiency in Bangladesh knitwear is an engineering discipline, not a matter of asking people to work faster. It turns on whether an IE team measures the assembly route it actually runs, sewing or linking, and its finishing separately in standard minutes, finds and fixes the true bottleneck, engineers the method rather than the effort, and holds the standard as styles change.
There is no silver bullet here, only a connected method: one comparable unit in SMV, operation-level measurement, method analysis on the constraint, and verification that the floor runs the standard. Get those working together and every point of efficiency the factory recovers turns straight into the margin it keeps.
Where to go next:
- Understand the unit: how to calculate an accurate SMV.
- Set a shared standard: the GSDCost method-time-cost solution.
- Close the standard-versus-actual gap: GSD RealMotion and GSDQuest.
- Turn standards into schedules: production planning with FastReactPlan.
Frequently Asked Questions
-
What is operator efficiency in a knitwear factory?
Operator efficiency is the standard time an operator earned from what they produced, divided by the time they were available to work, as a percentage. It compares the minutes an operation should take, its SMV, with the minutes the operator was paid to be there. It is the clearest measure of whether a factory is keeping the margin it was costed for.
-
How do you calculate operator efficiency?
Operator efficiency (%) = (units produced × SMV) ÷ minutes available × 100. For a whole line, line efficiency (%) = (line output × garment SMV) ÷ (operators × working minutes) × 100. Because operations carry different SMVs, two operators producing the same pieces can post very different efficiency, which is why measurement should sit at operation level.
-
What is a good operator efficiency percentage in a knit factory?
There is no single universal figure; it varies by style, line and factory. Industry sources place most Bangladesh factories around 50 to 60 per cent, a good level around 60 to 70 per cent, and best-in-class above 80 per cent. Garment OEE commonly sits at 40 to 60 per cent against a world-class 85 per cent. The useful target is steady, measured improvement per operation.
-
Why should sewing, linking and finishing be measured separately?
Because they are not alike, and because knitwear is assembled two ways. Cut-and-sew jersey uses sewing lines, sweaters use linking, and both use finishing. Sewing is a balanced progressive line, linking is a slow skill-intensive manual operation, and finishing is variable and rework-prone. A blended number averages them and hides which operation caps output.
-
Why is linking often the bottleneck in sweater production?
Linking joins knitted panels stitch by stitch, picking up both edges loop by loop. It is inherently slow, needs an operator trained for months to reach speed and accuracy, and requires a fresh setup whenever the gauge changes. Because it is manual and hard to time, many factories measure it loosely and never see that it, not sewing, caps sweater output.
-
Can linking be automated?
Semi-automatic and higher-speed linking equipment exists and is developing, but manual linking still dominates the sector because of the skill, flexibility and gauge changes involved. The practical first step is not automation but measurement: give linking its own SMV, standardise the changeover and balance it. Appraise equipment against the measured bottleneck rather than adopting it by default.
-
What is the difference between SMV and SAM?
Standard Minute Value (SMV) is the time a qualified operator at standard performance takes to complete an operation by a defined method, including allowances. Standard Allowed Minute (SAM) means the same thing and most factories use the terms interchangeably. Both are built as Basic Time (Observed Time × Performance Rating) plus allowances. Fix one definition before calculating so numbers stay comparable.
-
What is the difference between a stopwatch time study and PMTS or GSD?
A stopwatch time study records whatever the operator currently does, so it can freeze a poor method into the standard. A Predetermined Motion Time System breaks the operation into standard elemental motions, each with a predetermined time, so the method itself can be seen, costed and improved, even before a garment is made. GSD (General Sewing Data) is the PMTS built specifically for apparel.
-
What is line balancing and how does it improve operator efficiency?
Line balancing distributes work content across workstations so each carries roughly equal time. Without it, the line paces to its slowest operation, the bottleneck, while others sit idle and WIP piles up. Balancing against operation SMV cuts idle time and lifts output from the same number of operators. It is one of the highest-return efficiency levers, and it depends on accurate per-operation SMVs.
-
Does improving operator efficiency mean making operators work faster?
No. The largest, most repeatable gains come from method, not effort: better layout, shorter reach, less material handling, fewer non-value-adding motions and a balanced line. An operator working flat out with a poor method loses minutes on every piece. Fix the method once and every piece is faster, permanently, without extra strain.
-
Should operator efficiency be tied to incentive pay?
Incentive schemes are a proven lever, but only when built on accurate, consistent SMVs. If the standard is soft or inconsistent, an incentive scheme quietly rewards a flawed target and entrenches poor method. Fix the standard first with disciplined method analysis, then design the incentive so it rewards genuine performance against a fair, defensible operation time.
-
What causes low operator efficiency in Bangladesh knitwear factories?
Common causes are line imbalance, an unmeasured bottleneck (often linking in sweaters), poor workplace method and non-value-adding motion, inconsistent or stopwatch-frozen SMVs, weak operator-to-operation skill matching, long learning curves on seasonal styles, absenteeism, and hidden rework in finishing. Most are method and measurement problems, not a lack of operator effort.
-
How much can operator efficiency realistically improve?
Published outcomes are directional and vary by factory. Coats Digital customers have reported productivity gains of roughly 5 to 15 per cent and SMV or production-time reductions of about 11 to 25 per cent after adopting a method-time-cost standard, for example a Bangladesh composite knit manufacturer cutting core-style production time by around 25.6 per cent. Results depend on the starting point, product mix and how consistently the method is sustained.
-
What is GSDCost and how does it help operator efficiency?
GSDCost is Coats Digital’s SaaS method-time-cost solution, built on GSD and widely regarded as the apparel industry’s standard. It uses 39 predetermined motion codes to build accurate, consistent SMVs and method standards, so engineers can analyse and improve each operation, balance lines and plan capacity across sewing and finishing. Coats Digital reports it has proven to improve productivity by around 10 per cent.
-
How does operator efficiency affect a factory’s profit margin?
A knit factory is paid a fixed Cost of Make per garment, costed on standard minutes. It keeps only the difference between the minutes it was costed for and the minutes it actually uses. Every point of efficiency below the costed level is margin lost to extra labour and overtime. On value-end knit basics, where labour is a large share of the controllable cost, operator efficiency is effectively the factory’s margin.
-
How often should operator efficiency be measured?
Continuously, at operation level, not once per style. Because knitwear is seasonal and style-heavy, every changeover restarts the learning curve and can shift the bottleneck, so operation SMVs, line balance and standard-versus-actual method should be re-checked on a rolling basis. Treating efficiency as a living measurement rather than a fixed report is what keeps gains from drifting away within a season.

How Bangladesh Knitwear Factories Improve Operator Efficiency Across Sewing, Linking and Finishing

Best Lean Manufacturing Software for the Indian Garment Industry

Brand-to-Vendor Cost Collaboration: Which Layer of the Cost Stack Are You Missing?
All Blog Categories
- Production Planning
- Corporate
- Method Time Cost Optimisation
- Supply Chain Solutions
- Sustainability
- Videos