Why AI-Powered Costing Is Essential for US Apparel Sourcing
by Kunal Kapur
 9
Mins Read
9
Mins Read
Key Takeaways
- US apparel import duties averaged 35.1% by December 2025, up from 14.7% in January 2025. Spreadsheet costing models built for a 15% duty environment are structurally broken.
- FOB pricing now captures only 60–70% of true cost; Total Landed Cost (TLC) is the only metric that reflects actual margin.
- Coats Digital’s GSDQuest can generate a full Bill of Labour from a single garment image, instantly replacing hours of manual Industrial Engineering work.
- Tariff simulation modelling landed cost across 8–10 sourcing countries simultaneously has become the primary margin lever for US apparel sourcing teams.
- For many SKU types, USMCA-qualifying Mexico and CAFTA-DR Central America now produce a lower landed cost than Vietnam or Cambodia, despite higher FOB prices.
- AI costing delivers full margin benefit only when demand forecasting and costing share the same data layer. A perfectly costed SKU that misses sell-through projections still loses money.
- Costing cycle time is the clearest indicator of competitive readiness: if your team takes more than 24 hours to re-cost your top 50 SKUs in response to a tariff shift, the software system is the constraint, not the supply chain.
Table of Contents
The 2025–2026 Tariff Upheaval and What It Means for Sourcing
The average tariff rate on US apparel imports under HS Chapters 61 and 62 climbed from 14.7% in January 2025 to 35.1% by December 2025, the highest level in decades, driven by IEEPA-based reciprocal tariffs imposed during President Trump’s second term. That trajectory was followed, in February 2026, by one of the most consequential trade rulings in a generation.
On February 20, 2026, the Supreme Court ruled 6–3, in Learning Resources, Inc. v. Trump and Trump v. V.O.S. Selections, Inc., that IEEPA does not authorise the President to impose tariffs. Writing for the majority, Chief Justice Roberts held that IEEPA’s grant of authority to “regulate importation” does not encompass the power to levy tariffs, which is constitutionally reserved for Congress.
Within hours of the ruling, the Trump administration replaced the IEEPA tariffs with a 15% flat surcharge on most imports under Section 122 of the Trade Act of 1974, effective February 24, 2026, while preserving existing exemptions for USMCA-qualifying goods and CAFTA-DR textile and apparel articles. Then on May 7, 2026, a divided panel of the US Court of International Trade struck down the Section 122 tariffs as well, finding that the statutory conditions for invoking that authority were not satisfied, though the ruling’s injunction applied only to the plaintiffs before the court, and the government is expected to appeal.
The policy environment as of publication: IEEPA tariffs are being refunded by CBP for qualifying importers; Section 122 tariffs remain in collection pending the appeal’s outcome; USMCA and CAFTA-DR preferential treatment remains intact; and the administration has signalled new Section 301 investigations targeting additional countries. The de minimis exemption remains suspended globally.
What this means for sourcing teams:
Duty rates can swing by 20 or more percentage points within a single quarter, via a court decision, not a legislative vote. The sourcing teams hurt most by this environment are not necessarily those paying the highest current rate. They are the ones whose costing models cannot respond fast enough when the rate changes.
A static spreadsheet built around December 2025’s 35.1% average is as wrong in February 2026 as a model built around January 2025’s 14.7% was by year-end. The lesson from 18 months of tariff upheaval is not that one specific rate is wrong. It is that static models fail structurally.
What Is AI-Powered Costing?
AI-powered costing is the replacement of static, manually-updated cost estimates with a dynamic decision system that ingests multiple live data inputs, including garment construction, fibre composition, supplier performance, current freight rates, HTS classifications, and origin-specific duty rates, and produces a real-time Total Landed Cost that updates as conditions change.

Traditional costing takes a snapshot. AI-powered costing runs a continuous feed.
Where a spreadsheet gives you one number based on data entered weeks or months ago, an AI costing system gives you a scenario range across multiple sourcing origins and duty regimes, updated to reflect the current trade environment. Three technical capabilities define the category:
- Machine learning models trained on garment construction and trade data to predict cost components and surface optimisation opportunities.
- Computer vision that reads tech packs, sketches, or product photographs to auto-generate Bills of Labour and Standard Minute Values, replacing hours of Industrial Engineering analysis with seconds of automated output.
- Tariff scenario simulation that models the full landed cost impact of any policy change across an entire SKU portfolio simultaneously.
The operational distinction from traditional ERP costing modules is significant: ERP modules record costs based on what was manually entered. AI costing predicts and simulates costs based on what is actually happening and what could happen under alternative scenarios.
Total Landed Cost: The Only Metric That Matters
FOB pricing has one fundamental problem: it only tells you what the garment costs at the factory gate. It says nothing about the 30–40% of the cost that accumulates between the factory and the distribution centre.
Total Landed Cost (TLC) is the full expense of getting a garment unit from the production floor to a domestic distribution centre, ready to sell:
TLC = FOB Price + Inbound Freight + Duty/Tariff + Customs & Brokerage + Insurance + Inland Logistics + Compliance & QC + Inventory Carry
FOB typically represents 60–70% of TLC, the largest single component, but structurally the most stable. The variables actively moving margins in the current environment are the middle of the formula: duty and tariff, which can represent 10–25% of TLC at elevated rates, and inbound freight, which adds 5–12%. Together, those two components can change the true cost of a garment by 15–35% with no change at all to the factory price.
A brand pricing from FOB alone won’t see that variance until the import invoice arrives.
| Cost Component | Typical Share of TLC | 2026 Volatility |
| FOB Price | 60–70% | Low |
| Duty / Tariff | 10–25% | Very High |
| Inbound Freight | 5–12% | High |
| Customs & Brokerage | 1–3% | Moderate |
| Inventory Carry & Markdown Risk | 5–10% | High |
| Compliance & QC | 1–3% | Moderate |
This table represents practitioner-derived ranges synthesised from industry costing literature and is not drawn from a single published study. FOB’s share of TLC is supported by Epsilon Global Sourcing (55–70%) and Uphance’s garment costing analysis (TLC typically 15–30% above FOB). Individual component breakdowns for brokerage, compliance, and inventory carry reflect practitioner consensus and will vary materially by product category, shipment volume, origin country, shipping mode, and current duty rate. For origin-specific duty rates, consult the US International Trade Commission Harmonised Tariff Schedule. For freight benchmarks, consult the current Freightos or Flexport rate indices. This table should be reviewed quarterly.
The margin math only becomes accurate when every component in this table feeds a single, live costing model. That is what AI-powered costing delivers.
The Three Pillars of AI Costing

Pillar 1 · Computer Vision for Bill of Labour Generation
A Bill of Labour (BoL) documents every manufacturing operation in a garment, including seams, hems, attachments, pockets, finishes, and fastenings, and assigns a Standard Minute Value (SMV) to each, representing the time a trained operator requires to complete that step under standard performance conditions. The total SMV drives labour cost, line balancing, and production lead time. An inaccurate BoL means every downstream cost figure inherits that error.
Traditionally, generating a BoL required a certified Industrial Engineering specialist, a complete tech pack, and two to four hours of analysis per style. Across a seasonal range of 200–400 SKUs, that resource requirement creates a genuine constraint on how early in the design process accurate costing can happen.
Computer vision changes that. Multimodal AI analyses a garment photograph, tech pack PDF, or CAD sketch; identifies construction elements including hidden features; maps each operation to standardised motion codes; and produces a complete, validated BoL in seconds. Coats Digital’s GSDQuest launched in August 2025 as an AI-powered extension of the GSDCost platform, built on the proprietary QED Library of standard construction methods, which does exactly this. The output is grounded in internationally recognised standard motion codes and scientifically validated SMVs, making it suitable for both early costing at the sketch stage and supplier negotiation at the final approval stage. Critically, GSDQuest is designed to be accessible to any member of the sourcing or technical team, not just GSD-certified practitioners.
Costing at the sketch stage, rather than the sample stage, is where margin protection actually begins. By the time a sample is produced, design decisions that affect manufacturing cost have already been locked in.
Pillar 2 · Tariff Simulation and HTS Optimisation
Fibre composition and construction method are the two variables most responsible for HTS classification and, therefore, the duty rate for a garment. A change in fibre blend from 55% to 60% cotton can shift a knit top between HTS chapters. The difference between a woven and a knit construction can move a jacket into a different duty category entirely. Most sourcing teams are unaware of these thresholds because running HTS sensitivity analysis manually across a full seasonal range has never been practical.
ML models trained on HTS classification data can simulate landed cost across 8–10 sourcing countries simultaneously, factoring fibre composition and construction method, and identify the HTS arbitrage opportunities that spreadsheets structurally cannot reveal. The system surfaces cases where a minor construction adjustment, one that does not affect the product’s form, fit, or function, shifts the applicable duty rate by 5–15 percentage points.
At current MFN base rates of 10–32% for HS Chapters 61 and 62, a 10-point duty difference on a $12 FOB garment is $1.20 per unit. At 100,000 units, that is $120,000 in annual duty savings from a single HTS optimisation often achievable without changing the supplier, factory, or product specification.
Pillar 3 · Supplier Performance Layering
The cheapest quote rarely produces the lowest landed cost. A supplier who wins on FOB but ships 12 days late, carries a 4% defect rate, and misses OTDP (on-time delivery performance) targets on 20% of orders generates costs that never appear in the original quote: airfreight premiums, markdown risk, rework charges, and lost sales opportunities. Those costs are real; they just appear in other budget lines.
AI costing platforms that layer supplier performance data into the model, scoring vendors on lead time variance, defect history, capacity reliability, and OTDP, produce a risk-adjusted landed cost figure that reflects what working with that supplier actually costs over multiple seasons. This reframes the sourcing decision from “who quoted lowest” to “who delivers the lowest verified cost,” a materially different question, often with a materially different answer.
Global Sourcing Hub Comparison: Where the Math Has Shifted
The current duty environment has fundamentally altered the sourcing calculus that held for the previous two decades. Under the Section 122 surcharge (currently 15%, though under legal challenge), the uniform flat rate applies to most origins, but USMCA-qualifying goods remain exempt, and CAFTA-DR textile and apparel articles retain their duty-free status. Combined with MFN base rates, the effective duty burden varies significantly by origin.
For a practical example: a $4.00 FOB hoodie from Vietnam carries MFN base rates of approximately 12–20% on top of any applicable surcharges, plus 28–35 days of freight exposure. A comparable $5.20 FOB hoodie from Mexico, qualifying under USMCA, enters duty-free with a 2–7 day lead time. For replenishment programs, basics, and short-lead-time fashion, Mexico often wins the landed cost calculation despite the higher factory price.
This is not a case for abandoning Asian sourcing. High-complexity garments, depth of production capacity, and technical specialisation in categories like outerwear, swimwear, and performance apparel remain competitive from Vietnam and other Asian suppliers even under the current duty structure. The strategic answer for most mid-to-large US brands is a hybrid model: maintain deep-volume, high-complexity production in Asia while migrating volatile, duty-sensitive, short-turn SKUs to USMCA and CAFTA-DR origins.
| Country | Approx. Duty Burden (MFN + Surcharge, HS 61/62) | Lead Time to the US East Coast | Notes |
| Vietnam | 22–35%+ | 28–35 days | High production depth; strong in outerwear, swimwear |
| Bangladesh | 22–40%+ | 30–40 days | Large-volume knitwear strength |
| India | ~18–33% | 28–38 days | More competitive post-February 2026 bilateral deal |
| Cambodia | 22–45%+ | 30–40 days | High complexity capability; high duty exposure |
| Mexico (USMCA) | 0% | 2–7 days | Exempt from Section 122; USMCA qualifying goods |
| CAFTA-DR | 0% | 5–10 days | Textile/apparel explicitly exempt from Section 122 |
Duty burden ranges reflect MFN base rates (HS Chapters 61–62) from the USITC Harmonised Tariff Schedule plus the Section 122 surcharge of 10–15% where applicable. Country-specific category strengths are sourced from OTEXA/USITC trade data analysis by Dr Sheng Lu, University of Delaware (2024). USMCA and CAFTA-DR exemptions from Section 122 are confirmed in Presidential Proclamation 11012 (February 20, 2026) and US CBP guidance.
The “hybrid model” framing is supported by the USFIA 2025 Fashion Industry Benchmarking Study (Dr Sheng Lu / University of Delaware) and AlixPartners, “Nearshoring in Apparel: The Pendulum Is Swinging Back” (2025). Lead times are operational estimates based on practitioner consensus; verify with your freight forwarder for current schedules. CAFTA-DR utilisation rate (75.7%) is sourced from Dr Sheng Lu’s March 2026 OTEXA/USITC analysis. All rates subject to change; verify against the current USITC HTS data before making sourcing decisions.
Implementation Roadmap: 5 Stages to AI Costing ROI
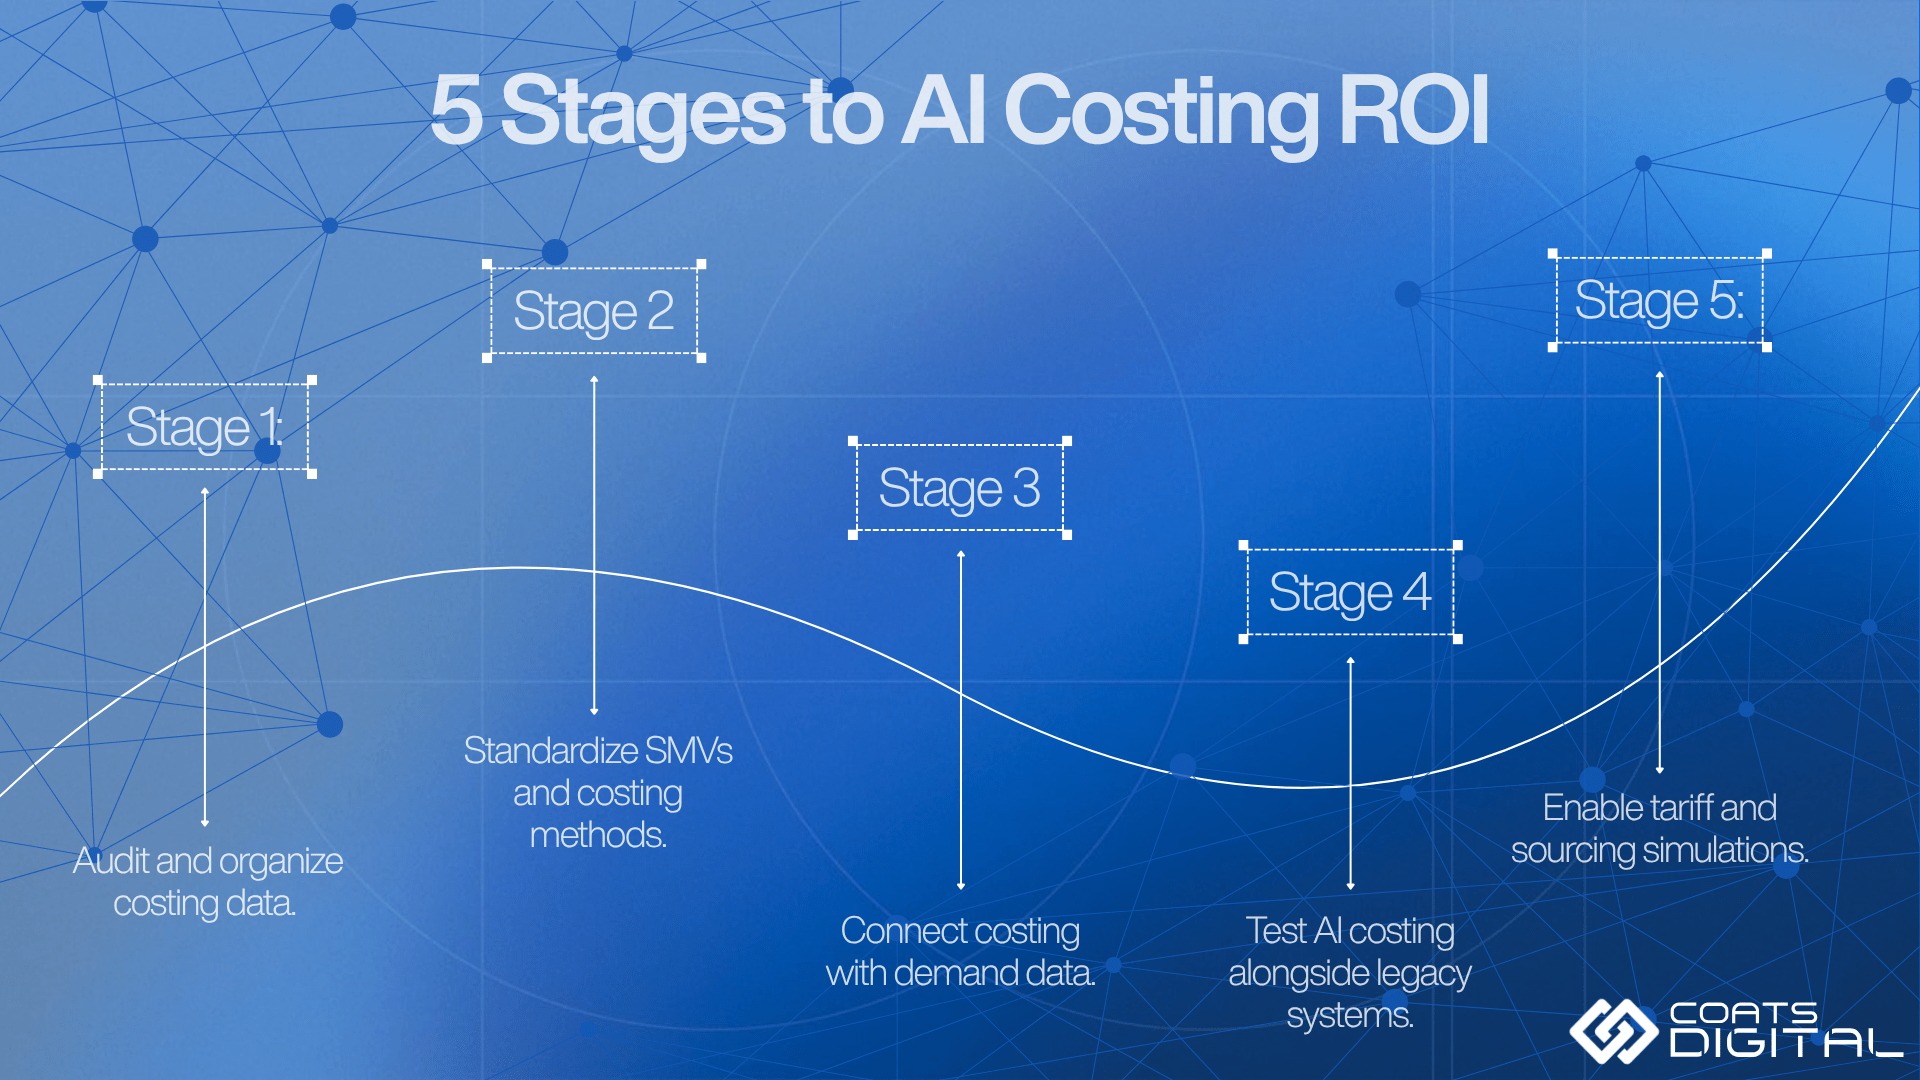
AI costing is not a software purchase. It is a data and process redesign that happens to include software. The brands achieving full ROI treat it that way.
Stage 1: Audit your costing data. Map where SMVs, Bills of Materials, freight rates, and HTS classifications currently live. Most brands discover this information spread across six to twelve spreadsheets, two or three ERP instances, and a backlog of email attachments. The audit surfaces not just where data lives, but what condition it is in, and which gaps need to be closed before AI outputs become reliable.
Stage 2: Standardise SMV at the operation level. This is the non-negotiable foundation. An AI costing model is only as accurate as the motion-code and time-value library it draws from. Without standardised SMVs aligned to a recognised methodology, such as GSD, every downstream prediction inherits whatever variance was built into the original estimates. Before adopting GSDCost, Suzhou Tianyuan Garments had SMV variations of up to 30% across production lines. After implementation, accuracy reached 98%, new product process analysis time dropped from four days to one, and sample development cycles shortened by 25%. That outcome required standardisation first.
Stage 3: Connect costing to demand signals. Wire the costing system to actual sell-through data, not seasonal forecasts built months in advance. A style costs accurately but is ordered at double its actual sell-through still ends up in markdown, and the markdown cost belongs in the landed cost model. When costing and demand share a data layer, the system can flag margin risk before the buy is placed.
Stage 4: Run shadow scenarios for 60–90 days. Cost every new style in parallel: once via the legacy method, once via the AI system. Document the variance. This phase builds internal credibility with sceptical stakeholders and surfaces data-quality issues that are invisible until the system processes real production inputs. Expect some surprises. The surprises are where the value is.
Stage 5: Layer in tariff simulation last. Once structural costing is reliable and the organisation trusts the outputs, add multi-country what-if modelling. This is where the board-level ROI becomes visible: the ability to re-cost an affected portfolio within hours of a tariff change, and to present leadership with a ranked list of sourcing migration options before the next morning’s briefing. This capability requires Stages 1–4 to be stable. Teams that skip to tariff simulation on an unstable data foundation produce impressive dashboards built on unreliable numbers.
The 5 Most Costly Sourcing Mistakes
These errors appear regularly across sourcing operations at brands of every size. The more that apply, the more urgent the case for a costing system upgrade.
- Pricing from FOB instead of Total Landed Cost. The most expensive single habit in US apparel sourcing. When duties averaged 14%, the margin gap between FOB and TLC was manageable. At 20–35%+, pricing from FOB alone routinely overstates margin by 15–30% per SKU. Every downstream decision built on a FOB-anchored cost model is built on a number that does not reflect what the unit actually costs to land.
- Ignoring HTS optimisation. The duty code applied to a garment is not fixed. It is a function of fibre composition, construction method, and country of origin variables that are partly within the sourcing team’s control during product development. Brands that never run HTS sensitivity analysis routinely pay duty rates 5–15 percentage points higher than they need to. The missed savings are permanent. There is no mechanism to recover duty paid on incorrectly classified or non-optimised entries after the fact.
- Manual vendor comparison. A spreadsheet comparing three supplier quotes captures the number each vendor wrote. It does not capture lead time variance, defect history, on-time delivery performance, or capacity reliability, the variables that determine what working with that supplier actually costs across a full season. Manual comparisons systematically favour the vendor with the lowest quote and the highest hidden costs.
- Set-and-forget seasonal costing. Costing once at season open and filing the number until delivery means operating on data that can be four to six months stale. In the current environment, duty rates, freight indices, and currency rates can move materially within a single quarter. A style cost in March at a 35% duty rate may land in August under an entirely different rate structure.
- Treating costing and forecasting as separate functions. A style with a precise cost and a missed demand forecast still loses money; it just loses in markdown rather than duty. Costing and forecasting need to share a single data layer because the decision they inform is the same: how many units, at what price, from which supplier. Organisations running these as independent functions are optimising two halves of one equation in separate rooms.
Implementation Realities
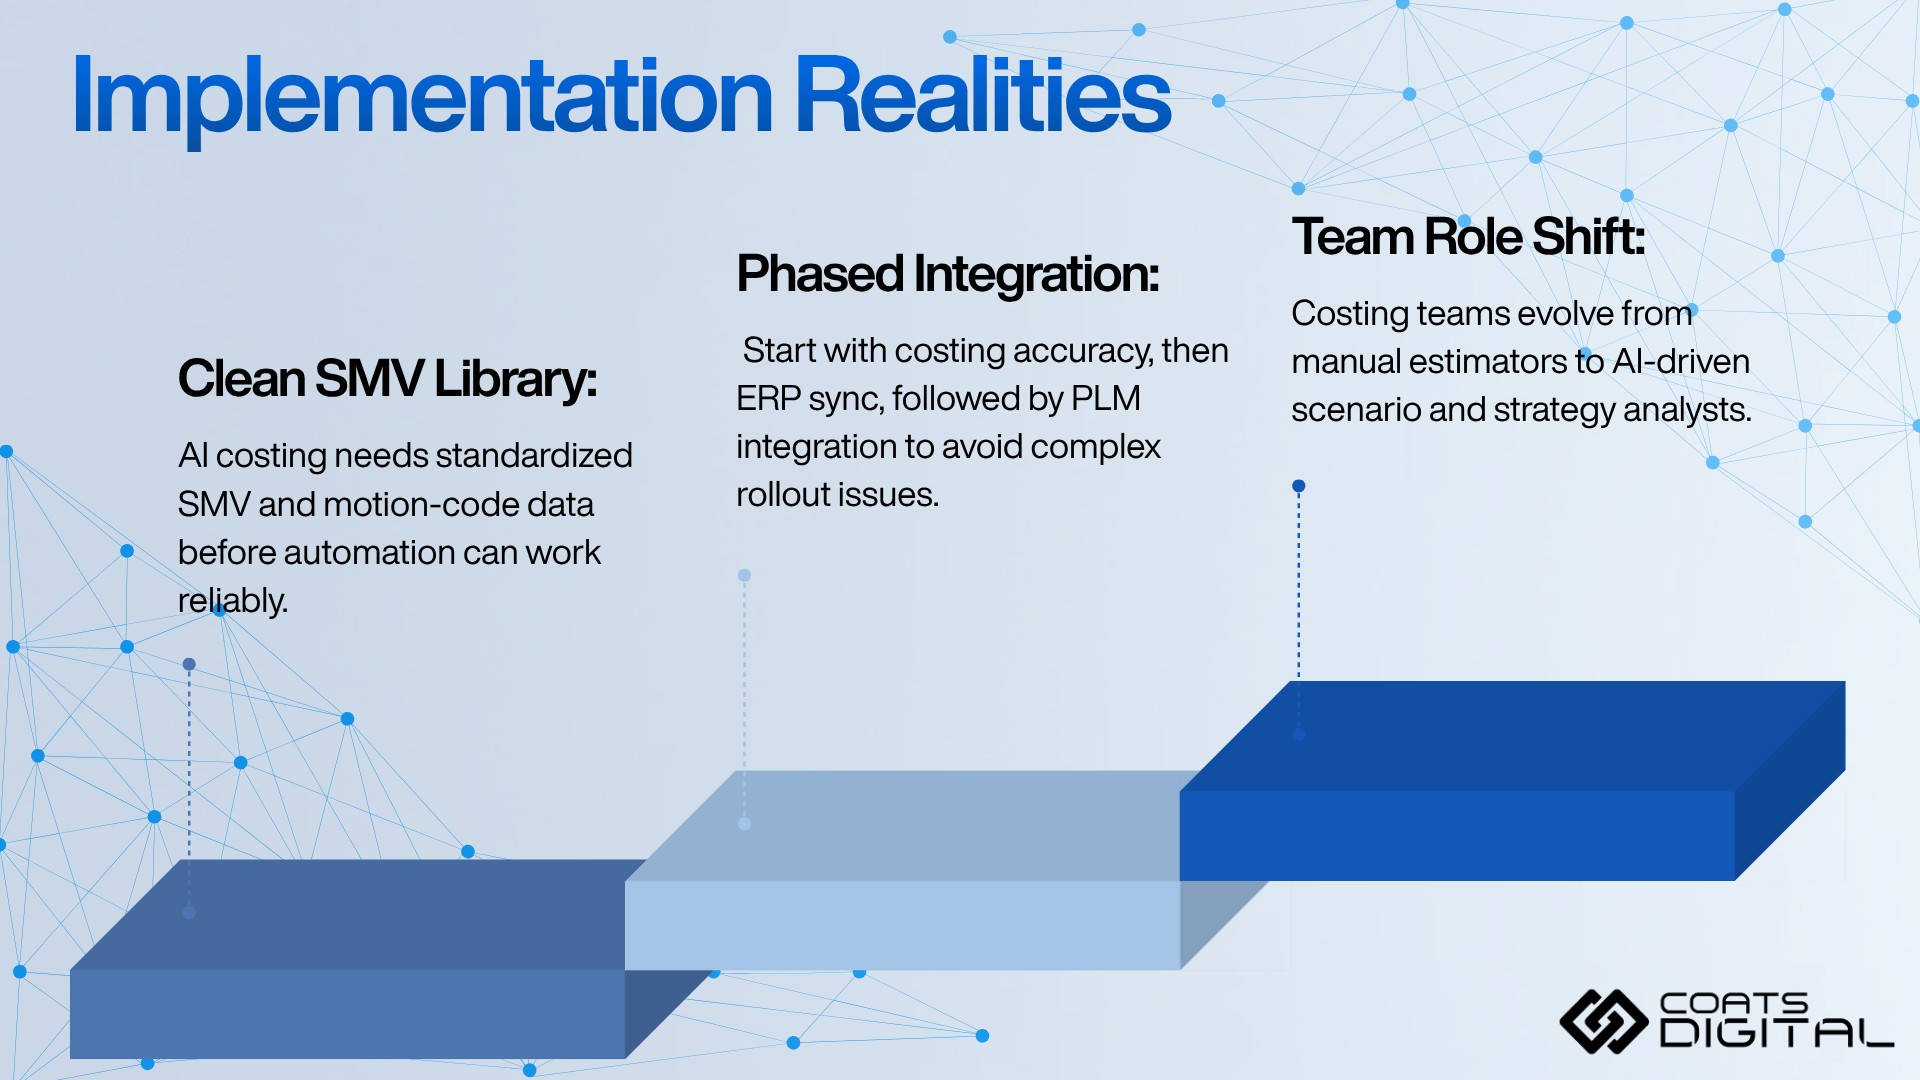
Most AI costing vendor materials lead with speed and accuracy numbers. They are right on both, but selective about what follows. Sourcing leaders evaluating these platforms deserve a direct account of what implementation actually requires.
The first hard dependency is a clean SMV library. AI systems that generate Bills of Labour from images need a validated reference corpus of standard motion codes and corresponding time values to map against. If that library doesn’t exist in a documented, standardised form, if it lives in the muscle memory of two engineers who have been with the company for a decade, building it is the first project, not the second. Standardisation typically takes four to twelve weeks, depending on the number of product categories and the current state of documentation.
The second reality is integration sequencing. Cost data in most brands is spread across PLM systems, ERP modules, supplier portals, and freight tools. Connecting AI costing to all of these simultaneously creates a change management burden that is consistently underestimated. The proven sequencing: costing accuracy first, ERP synchronisation second, PLM bidirectional integration third. Full integration typically takes 12–18 months for a mid-size brand, with measurable ROI often visible within the first 90 days of the standardisation phase.
The third shift is organisational. Costing teams do not disappear in an AI-powered model. Their role changes from “estimator,” someone who manually enters inputs and outputs a number, to “scenario analyst,” someone who interrogates AI-generated options, stress-tests assumptions, and connects cost data to sourcing strategy. That is a more valuable role, and most experienced costing professionals recognise it as such. But the transition requires deliberate change management, not just a software license.
Any vendor claiming a four-week, plug-and-play deployment should be asked to show you the implementation timeline for a brand with a data footprint similar to yours. Ninety days to stable costing and 12–18 months to full integration are not weaknesses; they reflect what it actually takes to build a costing capability that the organisation trusts and uses.
Closing Thoughts and Next Step
The 18 months between January 2025 and May 2026 produced two Supreme Court-level trade rulings, a mid-year tariff regime replacement, a subsequent court challenge, IEEPA refund proceedings, the end of de minimis globally, and new Section 301 investigation announcements, all while sourcing teams were trying to manage live season commitments.
Competitive advantage in this environment does not belong to the brands with the lowest current factory quotes. It belongs to the brands whose costing models update faster than trade policy.
Spreadsheet costing was built for a world where duty rates moved by a percentage point or two per year, freight rates were predictable, and the primary question in a sourcing meeting was which factory had the best stitch quality. That world has not existed since April 2025. The brands that are protecting margin now have one thing in common: they replaced static snapshots with dynamic decision systems that can model the cost implications of a court decision before the afternoon’s sourcing meeting.
Your next step: Audit your costing cycle time. If your team takes more than 24 hours to re-cost your top 50 SKUs against a new tariff scenario or logistics disruption, your software system, not your supply chain, is your primary constraint. That is the gap worth closing first.
Frequently Asked Questions
-
What is AI-powered costing in apparel?
AI-powered costing is a dynamic system that ingests live inputs, including freight rates, duty rates, supplier performance data, and garment construction details, and produces a real-time Total Landed Cost. Unlike ERP costing modules, which record historical cost, AI costing predicts and simulates cost across multiple scenarios and sourcing origins simultaneously.
-
What is Total Landed Cost (TLC) in apparel sourcing?
Total Landed Cost is the complete expense of delivering a garment from the factory to the domestic distribution centre: TLC = FOB Price + Inbound Freight + Duty/Tariff + Customs & Brokerage + Insurance + Inland Logistics + Compliance & QC + Inventory Carry. In a 20–35% duty environment, TLC typically runs 15–30% higher than FOB price alone, making FOB-only pricing a structurally unreliable margin metric.
-
What is the difference between AI-powered costing and an ERP costing module?
ERP costing modules record costs based on what was manually entered; they are historical ledgers. AI-powered costing ingests live external data (freight indices, duty rates, demand signals, construction images) and simulates cost forward across multiple scenarios. ERPs tell you what something costs. AI costing tells you what it will cost under any given set of conditions, and which conditions produce the best margin outcome.
-
How accurate is AI-powered garment costing?
Accuracy depends primarily on the quality and standardisation of the underlying SMV data. Where that foundation is strong, published results are meaningful: Suzhou Tianyuan Garments, a manufacturer producing over 26 million garments annually for brands including Adidas and The North Face, improved SMV accuracy to 98% after implementing Coats Digital’s GSDCost, alongside a 60% increase in process analysis efficiency, 95% cost estimation accuracy, and on-time delivery reaching 96%. The Suzhou Tianyuan case study is available on the Coats Digital website. The gap between strong and weak implementations traces primarily to data standardisation, not the AI technology itself.
-
Can AI predict tariff changes?
No. Trade policy decisions are political, not algorithmic, and no AI system can forecast a court ruling or executive action. What AI costing can do is model the full landed cost impact of any tariff change, including the SCOTUS IEEPA ruling, the Section 122 replacement, or a new Section 301 investigation across your entire SKU portfolio in seconds, the moment the new rate is announced. The value is not a prediction. It is response speed.
-
Which countries currently offer the lowest landed cost for US apparel imports?
Under the current tariff structure, USMCA-qualifying Mexico and CAFTA-DR members (El Salvador, Honduras, Guatemala, Nicaragua, Dominican Republic) offer the lowest landed cost for many apparel categories: both are exempt from the Section 122 surcharge and qualify for duty-free treatment, combined with 2–10 day lead times to US distribution centres. India became more competitive after a bilateral agreement in early 2026 reduced its effective rate. Vietnam, Bangladesh, and Cambodia retain advantages in depth of production capacity and technical complexity, but currently carry higher duty exposure. Rates are subject to change as Section 122 litigation, Section 301 investigations, and bilateral negotiations evolve. Always verify current rates against the USITC Harmonised Tariff Schedule before making sourcing decisions.
-
How long does AI-powered costing take to implement?
Measurable costing accuracy is typically achievable within 90 days of completing the SMV standardisation phase. Full integration with PLM, ERP, and demand planning systems typically takes 12–18 months for a mid-size brand. The timeline is driven primarily by the state of existing data and the number of systems requiring integration, not the AI technology itself.
-
Is AI-powered costing only viable for large brands?
No. SaaS delivery has made enterprise-grade costing accessible to mid-market brands from approximately $10M in revenue upward. The relevant constraint is data readiness, not company size. A $30M brand with clean, standardised SMV data and organised Bill of Materials documentation can implement AI costing faster and see ROI sooner than a $300M brand with fragmented legacy systems and inconsistent data standards across product lines.
-
How does AI costing connect to production planning?
The connection is direct. Costing produces the SMV for each garment style; production planning uses that SMV to balance sewing lines, allocate factory capacity, sequence production schedules, and forecast delivery dates. When costing and planning run from separate systems with separate SMV libraries, small discrepancies compound into material schedule variances across a full season. Both functions should operate from a single validated source of SMV truth.



All Blog Categories
- Supply Chain Solutions
- Sustainability
- Corporate
- Method Time Cost Optimisation
- Production Planning
- Videos