How Indian Garment Factories Plan and Balance Production Capacity Across the Year
by Kunal Kapur
 9
Mins Read
9
Mins Read
- Key Takeaways
- The Quote Arrives as a Single Number
- Why a Supplier Quote Is Never Just a Price
- Why “just send me a breakdown” is not enough
- What “Accurate” Actually Means
- Why labour is the variable that decides the quote
- The Independent Anchor: Standard Minute Value
- SMV and SAM: same measure, different label
- Predetermined motion time systems vs stopwatch time study
- Building the Cost Breakdown Before You Order
- Reading the Gap Between Your Number and Theirs
- When a higher quote is the better deal
- Separating fair-wage cost from inflation
- Red flags in a supplier breakdown
- Comparing Breakdowns Fairly Across Multiple Suppliers
- Issue one Bill of Labour and lock the SMVs
- Build vs Buy: Do You Need Software for This?
- What a spreadsheet and a trained partner can do
- What breaks at scale
- What a costing platform adds
- Walk In With Your Own Number
- Frequently Asked Questions
Key Takeaways
- Production capacity planning matches available minutes to confirmed and forecast demand, so a factory commits only to what it can deliver.
- Capacity and demand must both be measured in standard minutes. Pieces are not comparable across styles and hide the real load.
- The strategic choice is level, chase, or hybrid. Most Indian exporters run hybrid: a loaded core workforce plus buffered peaks.
- Idle months raise unit cost through fixed overheads and hand-trained operators to competitors who still have work.
- Overloaded months cost overtime premiums, changeover and learning-curve losses, rework, and slipped ship dates that damage buyer trust.
- Plan at 80 to 90 per cent of theoretical capacity. A full-capacity plan has no room for absenteeism, downtime or changeovers.
- In clusters with chronic labour shortages, smoothing the annual load is one of the cheapest worker-retention tools available.
- Planning software replaces disconnected spreadsheets with one visual board covering capacity, critical path and materials across every factory.
Indian garment factories balance production across the year by measuring capacity and demand in the same unit, standard minutes, laying the two against each other month by month, and then moving work between months before the calendar forces the decision. The tools are ordinary: pull work forward, book subcontracting early, sequence styles to cut changeover loss, and plan overtime deliberately. The discipline is not.
Every planning head in India knows the shape of a bad year. Lines at half load in February. September arriving with more work than the floor can absorb, paid for with overtime, a rushed farm-out and an uncomfortable call to the buyer about a ship date.
The instinct is to treat the peak as the problem. The peak is only where the cost becomes visible. Most of the bill is written in the quiet months, when overheads keep running against fewer produced minutes and trained operators drift to a unit down the road that still has work.
This is a method rather than a set of tips: how to measure capacity honestly, how to lay a year of demand against it, how to choose between level, chase and hybrid, and when a spreadsheet stops being enough.
What Is Production Capacity Planning In Garment Manufacturing?

Production capacity planning is the process of matching a factory’s available production capacity to its confirmed and forecast order demand over a defined horizon, so that the factory commits only to what it can realistically deliver. In apparel it runs across three connected horizons: strategic decisions about lines and investment, seasonal decisions about how volume is spread across months, and line-level decisions about which style runs where next week.
How do you calculate a factory’s available capacity?
Available minutes = Machines × Operators × Working hours × Efficiency
A unit with 250 machines running eight hours a day for 26 days has 3,120,000 theoretical minutes a month. At an achieved efficiency of 65 per cent, it has roughly 2,000,000 effective available minutes. That second number is the only one worth planning against.
The word doing the work in that formula is efficiency. A factory that plans on installed machine count rather than achieved efficiency is planning a factory it does not have.
Why capacity is measured in minutes, not pieces
A plan expressed in pieces is not really a plan. A basic tee and a lined jacket consume completely different amounts of work, so two months with identical piece counts can carry very different loads. Standard minutes put capacity and demand into the same currency, which is what makes months, styles and lines comparable at all.
That discipline comes from formal work study, set out in the International Labour Organization’s Introduction to Work Study, first published in 1957 and still the reference text for work measurement in sewn products. Standard Minute Value (SMV) is the time a qualified operator at standard performance needs for an operation, including allowances. Costing, line balancing and capacity planning all sit on top of it, which is why factories that get SMV calculation right find every downstream decision easier.
Why Production Load Is Never Even
Indian factories serve two calendars at once
Overseas buyers work to spring/summer (SS) and autumn/winter (AW) drops, with development in one window and bulk in another. Domestic demand answers to festival and wedding seasons, back-to-school buying and regional retail cycles. Categories add a third layer, since outerwear, knitwear and formal shirting do not peak together. The result is a load curve that is never flat and rarely repeats exactly.
The table below is a mental model, not a schedule. Real windows depend on buyer mix.
| Season | Typical order pressure | Planning implication |
| January to March | AW development for overseas buyers, domestic lull after the festive season | Often lean. Protect the core workforce and pull work forward |
| April to June | SS bulk for overseas brands, pre-monsoon domestic demand | Load building. Sequence styles early to limit changeover loss |
| July to September | AW bulk for overseas buyers, festival and wedding ramp | Rising pressure. Plan overtime and vetted subcontracting deliberately |
| October to December | Holiday ship dates, domestic festival and wedding peak | Highest load. Buffers and realistic delivery dates matter most |
The calendar breaks, and recently it broke twice
The last two years made this point better than any theory could.
A combined 50 per cent US tariff on Indian goods took effect on 27 August 2025. By late October, the Tiruppur Exporters’ Association (TEA) reported goods worth Rs 1,500 to Rs 2,000 crore stuck at ports, in factories and in warehouses, with fresh American orders halted (Deccan Herald, 21 October 2025).
Then it reversed.The United States-India Joint Statement of 6 February 2026 set a reciprocal tariff rate of 18 per cent on Indian goods including textiles and apparel, and the Ministry of Textiles described the agreement as opening a $118 billion global import market for Indian textiles, apparel and made-ups. Weeks later the position moved again: the US Supreme Court struck down the underlying reciprocal tariffs on 20 February 2026, and a flat 10 per cent surcharge under Section 122 of the Trade Act of 1974, capped at 150 days, took their place from 24 February 2026 (Global Trade Alert).
Three changes to the number your costing depends on, inside six months.
Here is the part planners should sit with. Through that turbulence, national apparel exports barely moved: the Apparel Export Promotion Council (AEPC) reported ready-made garment exports of $13,129.1 million for April to January of FY2025-26, growth of 1.6 per cent (AEPC, February 2026). Individual order books moved violently. Some units lost their US business almost overnight while others absorbed diverted volume. Aggregate stability tells you nothing about your own load curve, which is exactly why capacity planning is a factory-level discipline and cannot be outsourced to a market forecast.
What Unbalanced Capacity Actually Costs
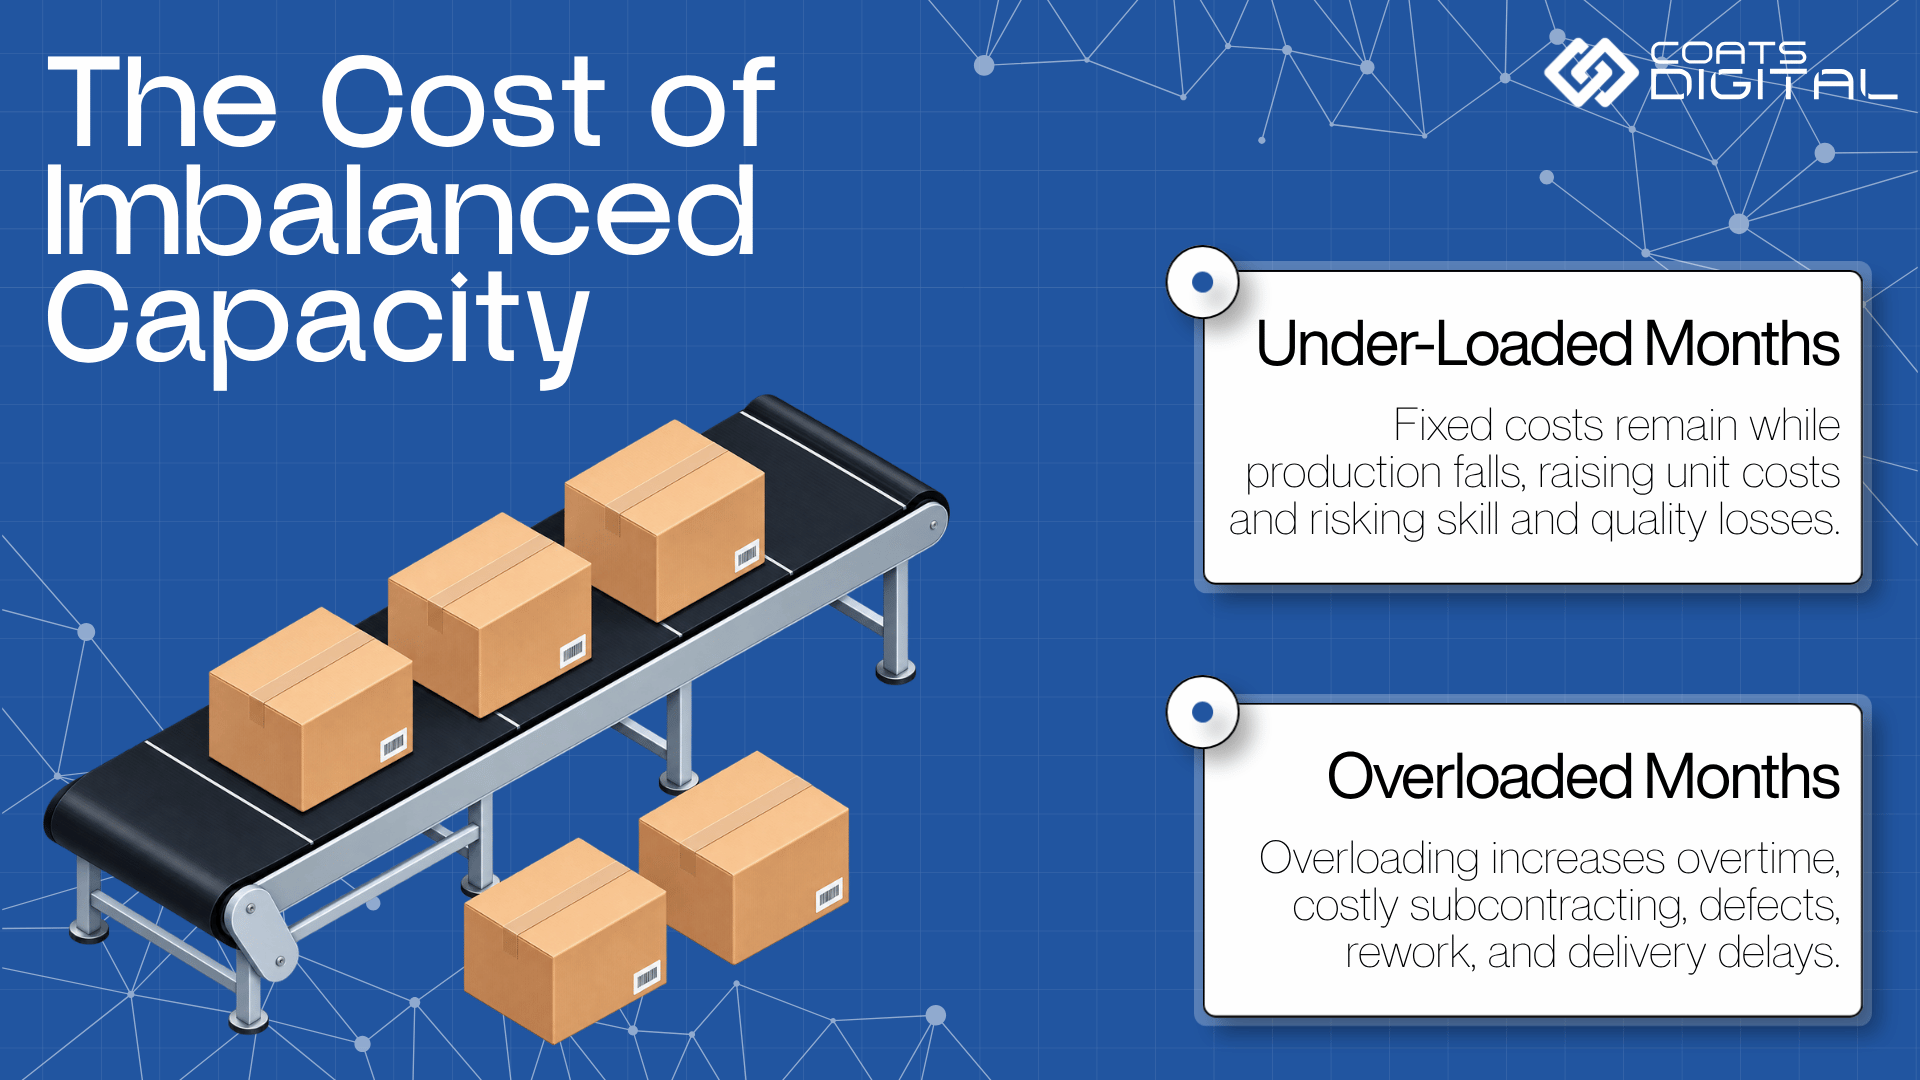
The cost of under-loaded months
Fixed costs do not fall when the load does. Rent, supervision, compliance, finance charges, and depreciation spread across fewer produced minutes, which raises the cost of every garment that does ship. Lines lose practice and quality suffers on restart.
The highest cost is the one that does not appear in any ledger. Reporting from Tiruppur in late 2025 captured the mechanism precisely: operators released by factories that had slowed down were quickly absorbed by units still running at or near full capacity. One factory’s idle month is another factory’s recruitment drive, and skills do not return on request.
The cost of overloaded months
The overloaded month has an obvious bill and a hidden one. The obvious bill is overtime premiums and subcontracting booked late at distress rates. The hidden bill is learning-curve and changeover loss from crowding new styles into too few weeks, defects and rework from a fatigued line, and delivery dates promised against theoretical capacity that reality cannot support. A slipped ship date outlasts the quarter it happened in.
| Cost dimension | Under-loaded months | Over-loaded months |
| Unit cost | Fixed overhead over fewer minutes, so cost per garment rises | Overtime premiums and rush rates, so cost per garment rises |
| Labour | Idle operators; skilled workers move to units still running | Fatigue, morale strain, higher error rates |
| Quality | Under-practised lines after gaps in work | Rework and defects from crowding styles and rushing |
| Delivery | Unused capacity and revenue left on the table | Slipped ship dates and damaged buyer trust |
| Hidden cost | Re-hiring and re-training when workers do not return | Learning-curve and changeover loss on too many new styles |
Read the columns together and the conclusion is uncomfortable but useful. Idle capacity and overloaded capacity are not two problems. They are the same failure pointing in opposite directions, and both come from having no plan for the year as a whole.
The Three Horizons Of Capacity Planning
Long-range or strategic planning, roughly one to three years
Where the Managing Director (MD), with the board and finance function, decides whether to add lines, invest in automation, enter or exit a category, and which subcontracting partners are worth developing over years rather than weeks. Driven by buyer commitments, capital position and a view of the market. Get this wrong and no amount of clever scheduling rescues it.
Medium-range or seasonal planning, roughly three to eighteen months
The aggregate layer, led by the planning head in coordination with merchandising, industrial engineering (IE) and sourcing, and where most of the value in this article sits. It answers three questions: how booked and forecast volume is distributed across months, whether the factory runs level, chase or hybrid, and what split between in-house production and subcontracting the year requires.
Short-range or line-level planning, weeks to days
Detailed line loading, style sequencing and line balancing, so no single workstation starves the rest of the line. This is where accurate SMVs earn their keep.
| Horizon | Time frame | Key decisions | Typical owner |
| Strategic | 1 to 3 years | New lines, automation, category entry or exit, long-term subcontracting partners | Managing Director, with the board and finance |
| Seasonal (aggregate) | 3 to 18 months | Volume distribution across months, level vs chase, make vs subcontract | Planning head, with merchandising, IE and sourcing |
| Line-level | Weeks to days | Line loading, style sequencing, line balancing | Planning and IE, with line supervisors |
The mark of a strong planning function is that the three connect. When a merchandiser accepts a rush order on a Tuesday, the decision should be visibly tested against the seasonal plan and the strategic capacity position, not only against next week’s line chart.
Level, Chase Or Hybrid: Choosing A Capacity Strategy
Level holds output and workforce steady across the year, building finished goods, components or cut parts in lean months for peaks to draw down. Retention and efficiency are excellent because lines stay practised and earnings stay predictable. The cost is inventory carrying and the cash tied up in it, which is a real constraint for micro, small and medium enterprise (MSME) exporters.
Chase flexes output to match demand through hiring, overtime and subcontracting. Inventory stays low, and working capital stays free. In a labour-short market, the penalty lands on people: attrition in lean months, re-training in peak months, and quality variance from operators still climbing the learning curve.
Hybrid keeps a stable core workforce loaded through the year, with planned overtime and vetted subcontracting absorbing peaks, and the plan built at 80 to 90 per cent of theoretical capacity so that absenteeism, downtime or a late fabric delivery does not cascade into missed ship dates. Most Indian exporters with a mixed buyer book run some version of this.
| Dimension | Level | Chase | Hybrid |
| Approach | Steady output and workforce; build inventory in lean months | Flex output via hiring, overtime, subcontracting | Loaded core plus buffered peaks |
| Inventory cost | High | Low | Moderate |
| Workforce stability | High, best retention | Low, attrition and re-training | High for the core |
| Cash flow | Cash tied up in stock | Lighter inventory, higher variable cost | Balanced |
| Quality risk | Low, practised lines | Higher, new hires and rushing | Controlled |
| Best fit | Steady buyer base with room to carry stock | Volatile demand, thin working capital | Mixed buyer book |
Choosing between them comes down to three questions. Can the balance sheet carry stock through a lean quarter? How predictable is the order book six months out? And how expensive is it, in your cluster, to replace a trained operator?
How To Build An Annual Capacity Plan
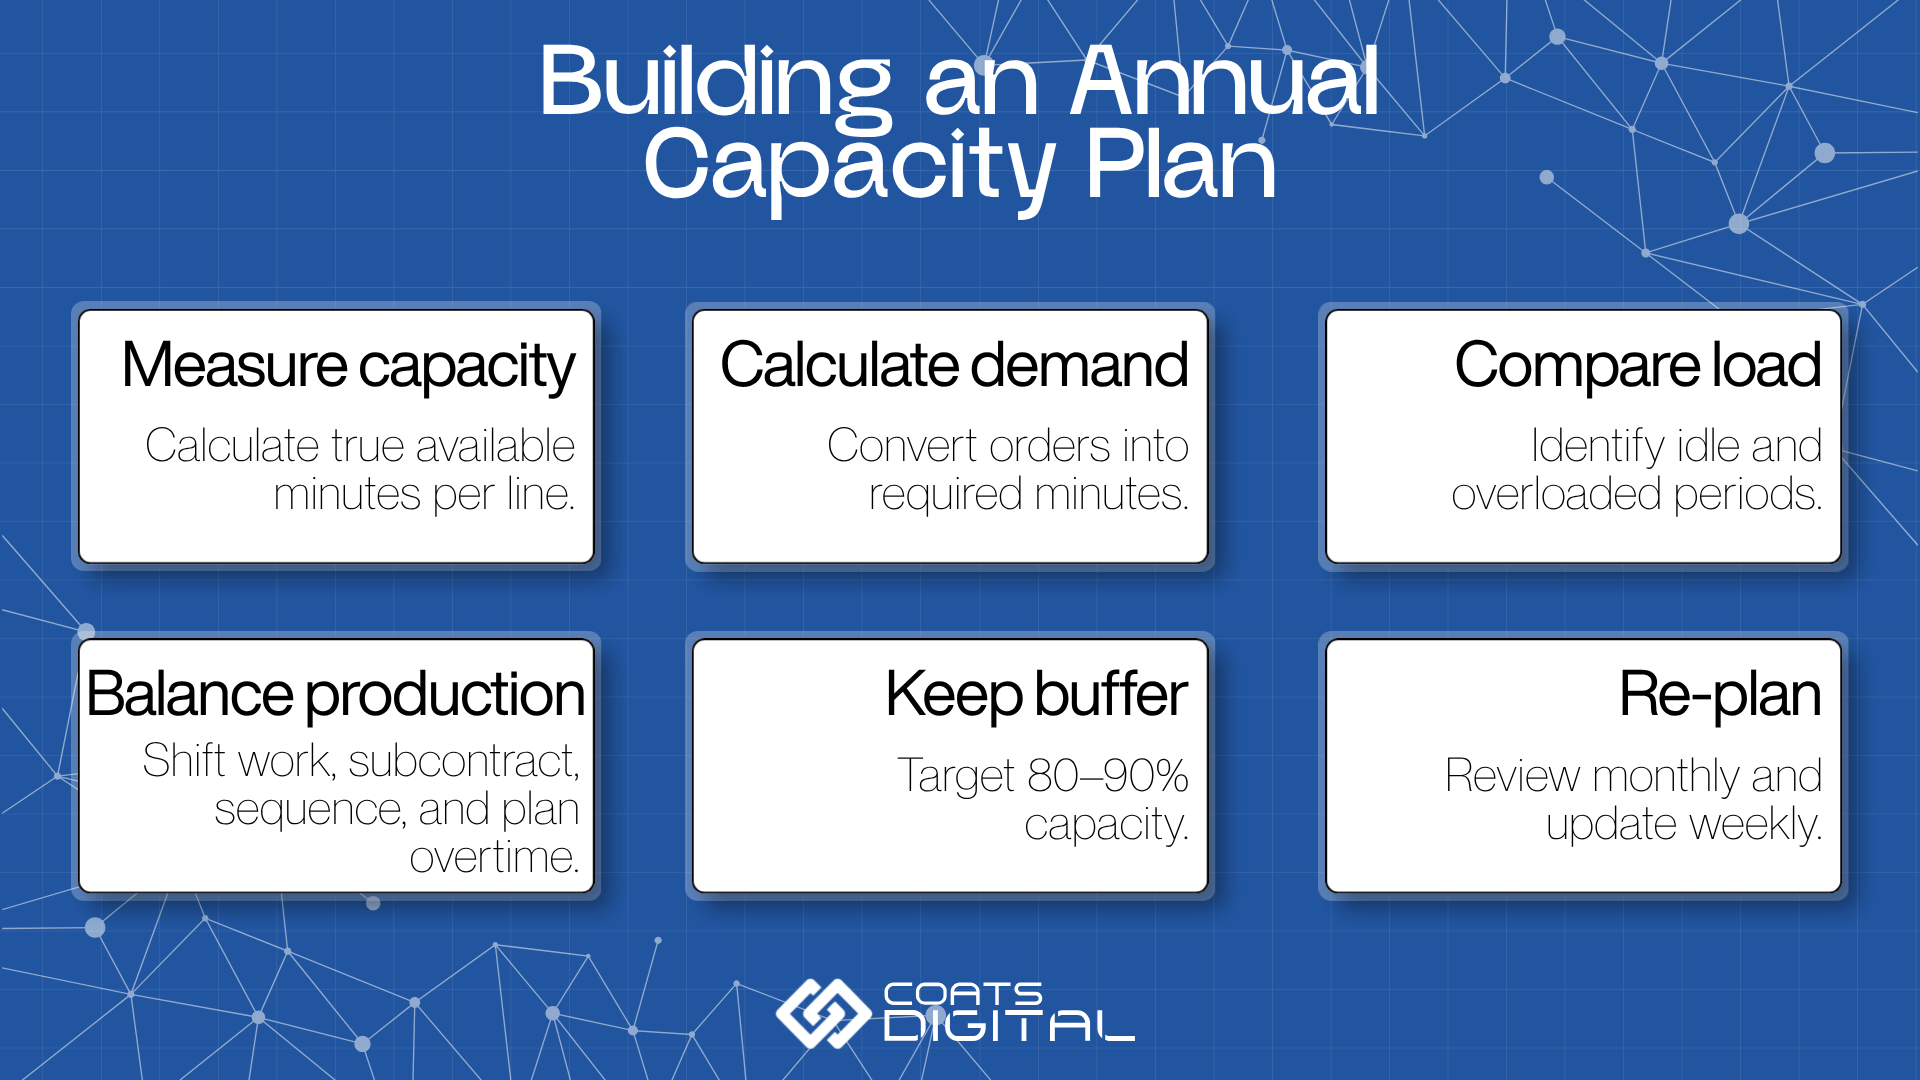
- Establish true available capacity per line, in standard minutes. Machines × operators × working hours × achieved efficiency, line by line, including the effect of normal absenteeism. Not a target from a wall chart.
- Convert the order book and forecast into required minutes. Style by style, month by month, from the operation bulletin and SMV database. Where SMVs come from stopwatch estimates rather than an auditable method standard, the plan inherits that error. A predetermined-time approach such as GSDCost produces a number that holds up in both planning and costing negotiations, and GSDQuest shortens the work of building a bulletin for a new style.
- Lay demand against capacity, month by month. Expressed as a percentage of available minutes, the idle windows and the overloaded windows announce themselves.
- Apply the smoothing levers, cheapest first. Pull non-urgent work forward into lean months. Adjust finished-goods build timing where the buyer relationship allows. Book subcontracting early with vetted partners at planned rates. Sequence styles to group similar work and cut changeover loss. Plan overtime as a decision rather than a reaction.
- Hold the buffer and re-check every date. Keep planned load at 80 to 90 per cent of capacity and re-test delivery dates against a realistic learning curve for each new style. A style at 60 per cent efficiency in week one is not a style at 85 per cent.
- Re-plan on a rolling basis. Orders confirm, buyers move dates, fabric arrives late. Review the aggregate plan monthly and line loading weekly. A plan reviewed once a year becomes fiction by March.
Worked example: closing a 700,000-minute gap
Take the unit above with 2,000,000 effective available minutes a month and an 85 per cent planning ceiling of 1,700,000 minutes. Its peak month is booked at 2,400,000 minutes. The prior month sits at 1,300,000.
| Peak month | Prior lean month | |
| Booked load before smoothing | 2,400,000 min (120% of effective capacity) | 1,300,000 min (65%) |
| Pull work forward | −250,000 | +250,000 |
| Place with a vetted subcontractor, booked early | −300,000 | no change |
| Planned overtime (adds capacity) | +150,000 capacity | no change |
| In-house load after smoothing | 1,850,000 min (93%) | 1,550,000 min (78%) |
Neither month is perfect, which is the point. The peak still runs hot, but on planned overtime at known rates rather than emergency overtime and a panicked farm-out. The lean month carries 250,000 minutes that would otherwise have been idle time with the same overheads attached. One decision improves both halves of the year, and it has to be taken in month one, not month nine.
Capacity Balancing Is A Retention Strategy
Skilled operators stay where earnings are predictable. A factory that keeps its core loaded through lean months avoids the exodus that leaves it short-handed exactly when peak orders land, and avoids paying twice, once to re-hire and again to re-train an operator back up the curve. Chronic overtime works the same way in reverse: it buys output this month and costs retention next quarter.
The constraint in India’s largest clusters is structural, not seasonal. In October 2025 the TEA president described a perennial shortage of about 1.5 lakh workers in Tiruppur. Pressure did not ease when the order book recovered. In mid-2026 TEA asked the Tamil Nadu government to make worker housing central to the new state industrial policy, proposing accommodation parks for one lakh workers in a first phase specifically to address the labour crunch (Apparel Resources, July 2026). At national level, AEPC has repeatedly flagged the skilled labour shortage as a brake on export growth alongside the need for faster capacity building.
Against that background, level-leaning capacity planning is among the cheapest retention tools an Indian factory has. It costs a planning decision rather than a wage revision.
- Steady monthly load, predictable take-home pay, lower voluntary attrition.
- A loaded core through lean months, skilled operators stay, no scramble at peak.
- Deliberate rather than chronic overtime, less burnout, better quality.
- Subcontracting booked early, the core protected from unsustainable hours.
When Spreadsheets Stop Being Enough
Spreadsheets are a legitimate starting point, and many capable single-site units plan well with them. They fail in three predictable ways as a factory grows. Versions multiply until nobody knows which file is the plan. Nothing connects the sewing plan to the pre-production critical path and material availability, so a fabric delay surfaces as a surprise instead of a re-plan.And testing an alternative, such as what a moved order does to November, becomes a manual rebuild nobody has time for in the week it matters.
A dedicated garment production planning system replaces that with a single visual board where capacity, critical path and materials sit together, a head-office control-tower view across units, and material requirements driven on a LEAN pull basis from the latest plan. FastReactPlan is Coats Digital’s system in this category. Coats Digital reports it is used by over 500 customers and embedded in more than 2,000 factories across 40 countries, that it typically returns its investment inside 12 months, and that recent releases add an AI analytics layer answering KPI queries directly. Those figures are the vendor’s own and are not independently audited.
Customer-reported outcomes are more concrete, and the Indian evidence is the most relevant here. Madura Garments Exports, part of the Aditya Birla Group and one of India’s largest shirt manufacturers, reported producing 34.5 per cent more output with 25.5 per cent more machines and labour across two financial years, an operational efficiency gain of 7.1 per cent, with delivery penalties falling from nearly $1.3 million to under $67,000 and on-time-in-full moving from 35 per cent to nearly 85 per cent (Coats Digital case study; customer-reported figures from that implementation period). At Birdy Exports, the supply chain manager credited the system with at least a 5 per cent overall efficiency improvement and, more to the point for this article, with the visibility to prioritise work and balance load across production lines.
| Factory tier | Typical profile | Sensible starting point |
| Small unit | Single site, lean team, moving off ad-hoc Excel | Structured templates built on real SMVs and achieved efficiency; upgrade as volume grows |
| Mid-size exporter | Multiple lines, buyer pressure on OTD and lead time | Dedicated apparel planning software as one source of truth across planning, materials and critical path |
| Large or multi-factory group | Several units, backward linkage | Multi-factory master planning with a control-tower view, connected to shop-floor data capture |
Sequence matters more than software. A planning system fed inaccurate SMVs produces confident, well-presented, wrong plans. Fix the method data first, then automate the plan. For smaller units weighing the options, our guide to SMV management software for Indian garment MSMEs covers where to start.
Nine Capacity-Planning Mistakes Worth Auditing This Month
Planning in pieces instead of standard minutes. Cross-style and cross-month comparisons become meaningless, and high-work-content styles are systematically underestimated
.
Planning against installed machines or target efficiency instead of achieved efficiency. The floor you plan is then a floor you do not have, and every downstream date is optimistic before the first style loads.
Planning to 100 per cent of theoretical capacity. With no buffer, one absent operator group or one machine breakdown propagates through the whole month.
Ignoring the learning curve and changeover loss. New styles do not deliver target efficiency on day one, and a peak month crowded with them compounds the loss.
Committing sewing capacity without checking fabric and trim availability and the pre-production critical path. A late fabric delivery then surfaces as a missed ship date instead of a re-plan taken weeks earlier.
Treating subcontracting as an emergency lever. Booked late at distress rates it drains margin and control; booked early with vetted partners it is a planned part of the load.
Treating the annual plan as a document rather than a process. A plan that is not re-cut monthly stops describing the factory within a quarter.
Promising delivery dates to win the order, then checking capacity. The commitment should follow the minutes, not the other way round.
Releasing skilled workers in lean months. The saving is immediate and visible. The re-hiring and re-training cost is delayed, invisible and usually larger.
Three or more of these, and the binding constraint is the planning method rather than the shop floor.
Plan The Year, Not The Panic
Capacity planning decides whether a factory’s calendar works for it or against it, and whether commercial commitments rest on data or on hope. It runs from the MD’s three-year view down to next Tuesday’s line loading, and it is measured in minutes because that is the only unit in which capacity and demand can honestly be compared.
No strategy is universally right. Level, chase or hybrid depends on scale, cash position and buyer mix, and the correct answer changes as those change. What does not change is the principle: smoothing load is a margin lever and a retention lever at once, and in a market short of skilled operators, the second may matter more.
If it would help to see a full year of capacity on one board, including what a moved order does to every downstream date, you can arrange a FastReactPlan demonstration.
Frequently Asked Questions
-
What is production capacity planning in the garment industry?
It is the process of matching a factory’s available capacity, calculated as machines × operators × working hours × efficiency and expressed in standard minutes, to confirmed and forecast demand over a defined horizon. The purpose is to commit only to what the factory can deliver, so lines are neither idle in lean months nor overloaded in peaks. It spans strategic, seasonal and line-level horizons.
-
How do you calculate available production capacity in a garment factory?
Multiply machines by operators by working hours by achieved efficiency to get available minutes for the period. A unit with 250 machines running eight hours across 26 days has 3,120,000 theoretical minutes; at 65 per cent efficiency, roughly 2,000,000 effective minutes. Plan against the effective figure, and use the efficiency the floor actually delivers rather than a target.
-
What is the difference between level and chase production strategy?
Level holds output and workforce steady, building inventory in lean months to serve peaks. It protects retention and efficiency but ties up cash in stock. Chase flexes output to demand through hiring, overtime and subcontracting, keeping inventory low but paying in attrition, re-training and quality variance. Most Indian exporters run a hybrid: a loaded core workforce with buffered peaks.
-
Why do garment factories plan at 80 to 90 per cent of capacity?
Because absenteeism, machine downtime, changeovers and learning-curve losses are certainties rather than risks. Planning at full theoretical capacity leaves nothing to absorb them, so one bad day cascades into missed ship dates. A buffer of 80 to 90 per cent keeps the plan resilient and leaves headroom to accept an urgent order without triggering unplanned overtime or rushed subcontracting.
-
Should capacity be planned in pieces or standard minutes?
In standard minutes. Pieces are not comparable across styles, since a basic tee and a lined jacket carry very different work content, so piece-based plans hide the real load on a line. Standard minutes express capacity and demand in one unit, making months, styles and lines directly comparable. That comparability is what allows demand to be laid against capacity accurately.
-
How do Indian factories balance production across slow and busy months?
They forecast the year in standard minutes, lay demand against capacity month by month, and identify the idle and overloaded windows. Then they pull non-urgent work forward, adjust finished-goods timing, book vetted subcontracting early, sequence styles to cut changeover loss and plan overtime deliberately, keeping a stable core workforce loaded year-round while peaks are absorbed through buffered flex.
-
What are the three horizons of production capacity planning?
Strategic planning covers roughly one to three years and is led by the MD with the board and finance: new lines, automation and category decisions. Seasonal or aggregate planning covers three to eighteen months and is led by the planning head with merchandising, industrial engineering and sourcing: volume distribution across months and the level, chase or hybrid choice. Line-level planning covers weeks to days: line loading, style sequencing and line balancing.
-
How does capacity balancing help retain skilled garment workers?
Steady load means predictable earnings, one of the strongest reasons operators stay. Keeping the core loaded through lean months avoids the exodus that leaves a factory short-staffed at peak, and avoids re-hiring and re-training costs. In Tiruppur, where TEA has described a perennial shortage of roughly 1.5 lakh workers, released operators are quickly absorbed by units still running.
-
When should a factory subcontract instead of adding overtime?
Subcontract when peak demand exceeds what the core workforce can produce at sustainable hours and the work can move without risking quality or intellectual property. Book it early with vetted partners at planned rates, not distress rates. Overtime suits short, controllable spikes close to normal output. Chronic overtime burns out operators and erodes quality, so it is not a substitute for real capacity.
-
How does the learning curve affect capacity planning for new styles?
A new style does not reach target efficiency on day one. Operators climb a curve as they repeat operations, so early output per minute is lower and required minutes are higher. Plans assuming full efficiency from the start will slip on new styles. Build the curve into required minutes and delivery dates, and avoid crowding several new styles into a peak month.
-
What software do garment factories use for capacity and production planning?
Smaller units often start with structured spreadsheets, which break down at scale through version conflicts, no live view of bottlenecks and no fast way to test alternatives. Dedicated apparel planning software provides one visual drag-and-drop board integrating capacity, critical path and materials, with a control-tower view across factories. Coats Digital’s FastReactPlan is a widely used apparel-specialist example.
-
Can a small garment factory plan capacity without expensive software?
Yes, provided it plans in standard minutes, uses achieved rather than target efficiency, applies an 80 to 90 per cent buffer and updates the plan as orders confirm. The limits appear with growth: more lines, more styles and tighter buyer deadlines make manual planning error-prone. At that point dedicated software pays back by giving every department one live source of truth.

How Indian Garment Exporters Manage On-Time Delivery for Multiple Global Buyers at the Same Time

How US Clothing Brands Protect Profit Margins When Supplier Production Costs Go Up

Apparel Production Planning Software For Large Garment Manufacturers In Bangladesh
All Blog Categories
- Production Planning
- Corporate
- Design and Develop
- Fabric Optimisation
- Method Time Cost Optimisation
- Shop floor execution
- Supply Chain Solutions
- Sustainability
- Videos