Multi-Country Apparel Costing for US Brands: A 2026 Guide to China-Plus-One Sourcing
by Kunal Kapur
 9
Mins Read
9
Mins Read
Key Takeaways
- The move away from China is structural, not cyclical. Around 70% of US fashion companies no longer use China as their top apparel supplier, up from 60% in 2024 (USFIA Benchmarking Study, 2025).
- Tariffs have rewritten the costing maths. The average applied US apparel tariff rose from 14.7% in January 2025 to 26.4% by July 2025, and further to 35.1% by December 2025 (USITC data via Sheng Lu, University of Delaware).
- FOB-to-FOB comparison hides the one variable brands actually need to read: the labour cost. Real comparison requires isolating Cost-to-Make (CM).
- Standard Minute Values (SMVs) and a Bill of Labour (BOL) are the foundation for vendor-neutral, country-agnostic CM comparison.
- GSD/PMTS pre-production costing, rather than factory-by-factory stopwatch study, is the practical mechanism for brand-side, multi-vendor benchmarking at scale.
- Costing standardisation is a governance problem as much as a technical one. Excel-based country silos break down at four or more sourcing countries.
- Managing China-plus-one risk needs a stack, not a single tool: costing standardisation, tariff and HTS modelling, compliance (UFLPA, due diligence), capacity planning and total landed cost.
Why China-Plus-One Sourcing Created a Costing Problem
The sourcing map that US apparel brands worked from for the last two decades has been redrawn in under three years. In the 2025 USFIA Fashion Industry Benchmarking Study, authored by Dr Sheng Lu of the University of Delaware in partnership with the United States Fashion Industry Association, roughly 70% of surveyed US fashion companies reported that China was no longer their top apparel supplier, up from 60% in 2024 and a long way from the 25% to 30% range prior to the pandemic.
Nearly 60% of those companies plan to source from even more countries through 2027, explicitly excluding China. The trade data tell the same story: measured in apparel-specific terms, Vietnam overtook China as the largest US apparel supplier in 2025, accounting for 21.5% of import value, compared with China’s 13.7%, according to figures from the US Office of Textiles and Apparel (OTEXA).
The pressure behind that shift is now mostly fiscal. The average applied tariff on US apparel imports (HTS Chapters 61 and 62) climbed from 14.7% in January 2025 to 26.4% by July 2025, then to 35.1% by December 2025 (USITC data compiled by Sheng Lu). The de minimis exemption that once allowed low-value shipments to enter duty-free was withdrawn in 2025, first for China-origin goods and then more broadly. The BoF-McKinsey State of Fashion 2025 report frames the longer arc: US apparel imports from China fell six percentage points between 2019 and 2023, and tariffs are up roughly fivefold since 2015. Diversification stopped being a strategic option and became an operating reality.
That structural shift created a quieter operational problem underneath it. A brand now spread across Vietnam, Bangladesh, India, Cambodia, Mexico and beyond receives CM quotes in formats that do not line up: some FOB-bundled, some CM-only, some built from a stopwatch time study, some estimated by a factory supervisor between shifts. Each quote looks reasonable on its own, which is exactly why the problem stays invisible until allocation season, when three countries’ numbers refuse to reconcile, and nobody can explain the gap. When the costing method differs by country, a brand is no longer comparing factories. It is comparing quotes. The rest of this guide covers how to build one costing standard that holds across every country in a China-plus-one portfolio, and the wider tooling stack that has to sit around it.
On this page: Why FOB-only comparisons fail – Building the common language: SMV and the Bill of Labour. How to standardise costing across countries. Why does the cost per minute differ by country? Common costing failures: a self-diagnostic. Tools for managing sourcing risk.
Why FOB-Only Comparisons Fail Across Sourcing Countries
What an FOB price actually contains (and hides)
FOB (Free On Board) is the headline figure most sourcing conversations still revolve around, and it is exactly the wrong unit for cross-country comparison. An FOB price is a bundle. It folds together the cost of materials, the cost of converting those materials into a finished garment, and the factory’s own margin, and it does so on top of a cost base that is specific to one country.
Formula: FOB and landed cost decomposition
- FOB Price = BOM Cost + CM (Cost-to-Make) + Factory Margin
- Landed Cost = FOB + Freight + Import Duty + Inbound Handling
Only one component in that stack reflects how efficiently a factory actually sews: the Cost-to-Make. Material prices move with global commodity markets and a brand’s own nominated suppliers. Factory margin is a commercial negotiation. Country overhead is a function of location. CM is the variable that tells you whether one factory builds the garment more efficiently than another, and it is the only part of the FOB price that a method standard can hold constant across borders. Comparing two FOB numbers from two countries tells you which quote is lower. It does not tell you why, and it certainly does not isolate the labour cost.
The country variable problem
Labour rates, productivity, factory efficiency, machine capability, and contracted working hours all differ by country, and all of them are legitimate. A CM quote of $1.80 from Dhaka and $2.30 from Ho Chi Minh City is not comparable on its face, because the two numbers sit on different underlying assumptions about how long the garment takes to make, how efficiently the line runs, and what a fair wage costs in each location. Without knowing the time assumption beneath each quote, a brand cannot tell whether the cheaper number reflects a more efficient factory or simply a more optimistic estimate.
Snippet definition: To compare CM costs fairly across sourcing countries, brands must isolate Cost-to-Make by applying a single SMV-based method standard to every vendor, regardless of location. The only legitimate point of difference then becomes cost-per-minute, derived from the same method standard.
The International Labour Organisation has documented the same effect in its work on open costing, where one garment costs across three sourcing countries produces three structurally different cost sheets. None of those sheets is dishonest. A factory’s reported time reflects its own line, its own operators, and its own margin maths, which is precisely why a brand needs an independent baseline rather than a vendor’s self-assessment. Manufacturers describe the problem in almost identical language.
When JD United, a jeans specialist running 31 factories across China, Tanzania, Myanmar, and Cambodia, adopted a method-time standard in 2025, its business director traced the firm’s costing troubles to “inaccurate historical data and inconsistent time studies” that turned every customer CM conversation into a negotiation. If a single manufacturer with four countries under one roof hits that wall, a brand comparing independent vendors across six hits it repeatedly.
Building the Common Language: SMV and the Bill of Labour
SMV as the universal unit of labour cost
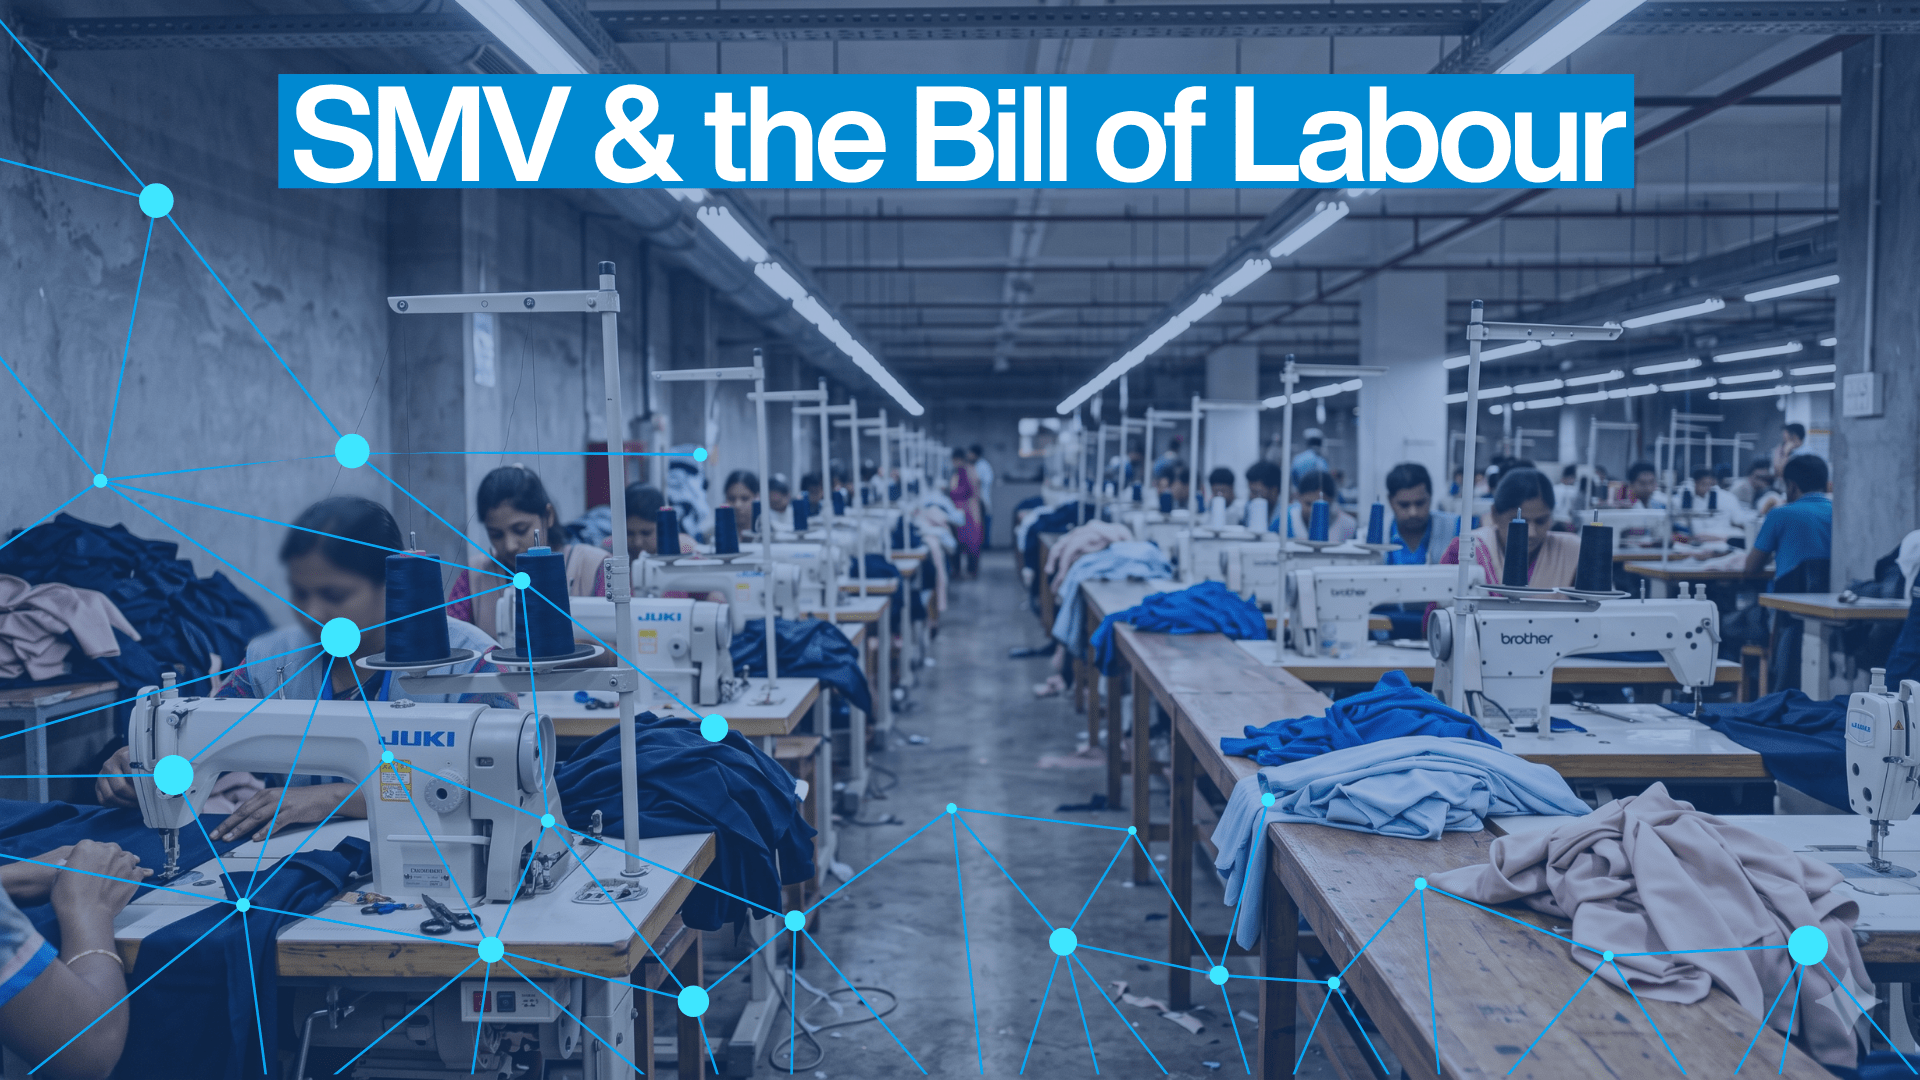
The fix is to stop comparing prices and start comparing time, then attach cost to that time. The unit that makes this possible is the Standard Minute Value.
Definition: Standard Minute Value (SMV) The standard time, in minutes, for a qualified operator working at standard performance to complete a specific operation, inclusive of allowances. The concept is anchored in the ILO work study methodology and is the de facto unit of labour measurement across the sewn-products industry.
When a brand issues a request with pre-agreed SMVs to vendors in Vietnam, Bangladesh, and India at the same time, every CM quote that comes back is anchored to the same time assumption. The factory can no longer set its own clock. The only variable left is cost-per-minute, which legitimately differs by country and is precisely the variable a sourcing team needs to compare.
Formula: CM and cost-per-minute
- CM Cost = Total Garment SMV × Factory
- Cost-Per-Minute Cost-Per-Minute = Monthly Labour Cost ÷ Available Productive Minutes Per Month
The Bill of Labour: the brand’s cross-country costing template
If a Bill of Materials lists every component a garment is made from, a Bill of Labour lists every operation it is made through.
Definition: Bill of Labour (BOL) An operation-level breakdown of every cutting, sewing and finishing step in a garment style, with a pre-assigned SMV for each operation. BOM covers materials; BOL covers labour. When a brand issues a standardised BOL to multiple vendors, every CM quote it receives is anchored to the same time and the same method.
A standardised BOL is what turns “compare these three quotes” into “compare these three factories”. Coats Digital built that capability into GSDCost through its Costing Excellence functionality, released in June 2024. A brand creates a credible Bill of Labour from GSD’s predetermined motion codes, issues it to several vendors at once, and reviews the returned CM responses on a single screen, every one anchored to the same International Standard Time Benchmarks. The built-in Fair Wage Tool, drawing on Fair Wage Network data, lets the brand fix a fair living wage allowance for the garment in any factory in the world. The system runs on 39 standard motion codes, which act as the building blocks for thousands of operations and, from there, any garment style a brand needs to cost.
The table below shows the structure rather than real numbers. The SMV column is fixed by the brand. Only the CM columns, returned by each vendor, are allowed to differ.
| Operation | Illustrative SMV (GSD-style) | Vietnam CM | Bangladesh CM | India CM |
| Shoulder join | 0.38 min | vendor-returned | vendor-returned | vendor-returned |
| Collar attach | 0.54 min | vendor-returned | vendor-returned | vendor-returned |
| Sleeve attach (×2) | 0.72 min | vendor-returned | vendor-returned | vendor-returned |
| Side seam (×2) | 0.46 min | vendor-returned | vendor-returned | vendor-returned |
| Total (partial illustration) | 2.10 min | n/a | n/a | n/a |
The four operations above total 2.10 minutes. A complete style, once hemming, plackets, cuffs, buttonholing, pressing, and packing are added, typically runs to roughly 3.5 minutes or more. The SMV figures here are illustrative and exist only to show the format. The point is structural: because the time is locked by the brand, each vendor can only compete on cost-per-minute, efficiency, and capability, which is exactly the comparison a sourcing team wants to make.
How to Standardise Garment Costing Across Multiple Sourcing Countries
Step 1: Standardise the method, not just the time
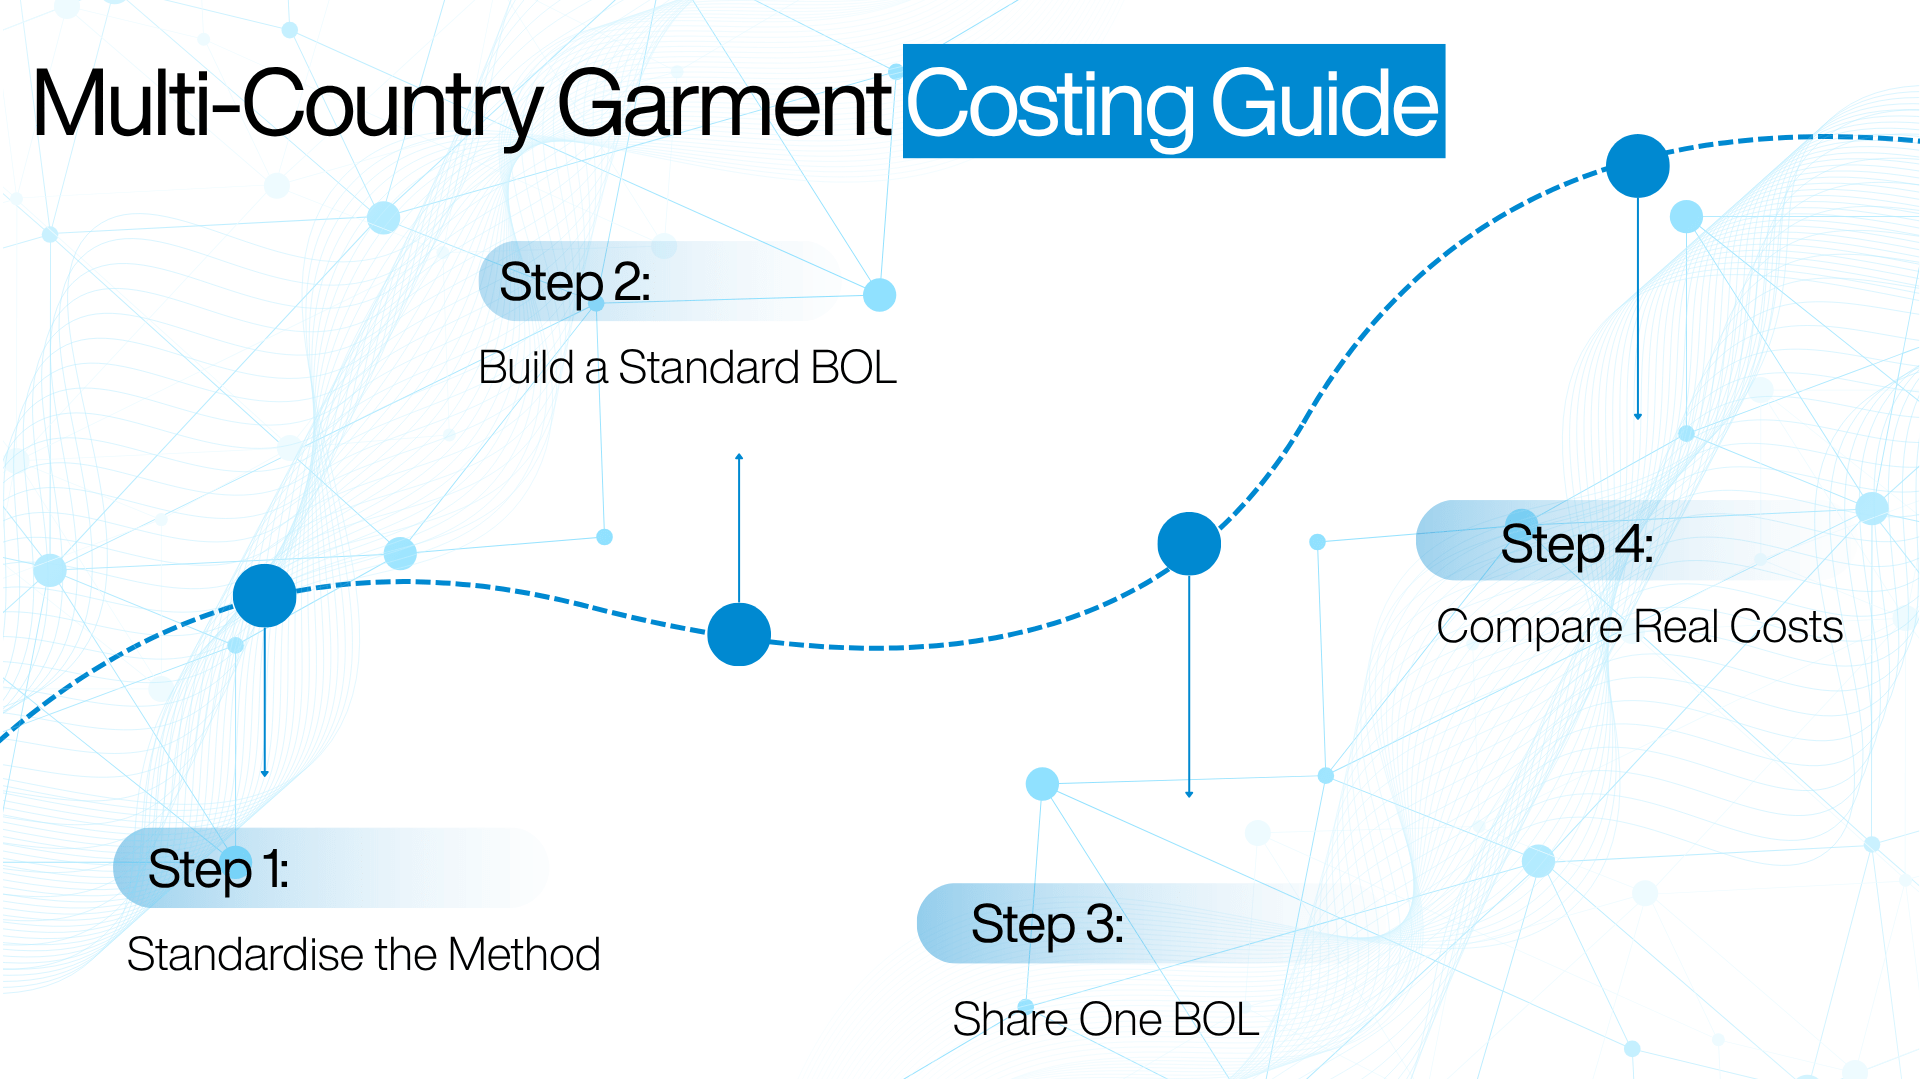
Before any SMV is assigned, the construction method has to be agreed upon across every vendor factory. If Vietnam sews a collar in one pass and Bangladesh uses two, the SMV legitimately differs, and the comparison breaks before it begins. In practice, this is the step brands skip most often, and it is the root cause of most “incomparable SMV” complaints. The fault usually traces back to a tech pack that specified the fabric in forensic detail but left the operation bulletin vague, so each factory filled the gap with its own construction sequence. Pin the approved method down in the operation bulletin, and every factory ends up costing the same garment built the same way. Method first, then time.
Step 2: Build the Bill of Labour using PMTS/GSD, not a stopwatch
Predetermined Motion Time Systems, of which GSD is the most widely used in apparel, produce method-anchored SMVs that are independent of any single factory’s current performance. A stopwatch study cannot do this work for a brand. It requires a running production line, it produces a result specific to the factory studied, and it cannot be run simultaneously across vendors in multiple countries before production starts. GSD generates a standard time from a construction description alone. For brands working at speed, GSDQuest, launched by Coats Digital in August 2025, uses AI to analyse product images, PDFs, and tech packs, identify the design and construction elements, and apply the proprietary QED Library to generate a standardised Bill of Labour in seconds. Coats Digital reports that GSDQuest reduces costing time by around 90%, and that it is designed to be usable by sourcing and design teams, not only certified GSD practitioners.
Step 3: Issue the BOL to multiple vendors simultaneously
With the method fixed and the SMVs locked, the brand issues the standardised BOL to vendors in each target sourcing country through a single platform request. Vendors respond with their cost-per-minute and their factory efficiency. Because the time is already set, no factory can quietly report a time that flatters its own margin. The negotiation moves from “trust my number” to “here is my cost against your standard”.
Step 4: Compare CM responses on a like-for-like basis
The submissions are now comparable, everyone anchored to the same BOL. That comparison pulls apart four things that used to sit tangled inside a single FOB number: cost-per-minute by country, the efficiency assumption behind each quote, fair-wage compliance, and machine-capability fit. It also exposes the trap that catches most sourcing teams: “the lowest quoted cost-per-minute is often not the cheapest factory.”
Formula: Effective cost-per-minute
Effective Cost-Per-Minute = Quoted Cost-Per-Minute ÷ Factory Efficiency %
A factory quoting $0.10 per minute at 55% efficiency carries an effective cost of roughly $0.182 per minute. A factory quoting $0.13 per minute at 80% efficiency comes in around $0.163, cheaper in real terms despite the higher headline rate. The figures here are illustrative; the logic is not. Efficiency is part of the price; the headline-rate factory often wins the quote and loses the season, and a standardised BOL is what lets a brand see that before the order is placed.
Step 5: Embed governance: version control, audit trail, a living BOL
Costing standardisation is not a one-season project, and the most common way it fails is quiet and administrative. A BOL has to be version-controlled, updated whenever a method changes, and held as a single centralised brand asset rather than copied into a spreadsheet in every sourcing office. The failure to name here is the uncontrolled Excel copy: New York, Hong Kong, and Dhaka each working from a different version of the same BOL, each with slightly different SMVs, all in use at once with different vendors. By season-end, the cost comparisons no longer reconcile, and the allocation decision they supported becomes impossible to defend.
A worked scenario. A US activewear brand is moving 30% of its basic knit production out of China into a dual-sourcing model split between Vietnam and India. It issues a GSD-derived BOL for a core style, receives CM quotes from both vendor sets anchored to that BOL, and allocates volume on effective cost-per-minute rather than headline FOB. The precedent for this at scale already exists on the manufacturing side. SAE-A, one of the world’s largest apparel manufacturers, implemented GSDCost across all 41 of its production facilities in ten countries, specifically to embed what its manufacturing excellence team called “a common language embedded within all our global facilities” for measuring the real Cost-to-Make of each garment. A brand standardising costing across a multi-country vendor base is solving the same problem, from the buying side of the table.
Why Cost-Per-Minute Differs Across China-Plus-One Countries
Why does the cost per minute vary
Once CM is standardised, the differences that remain between countries are real and worth understanding rather than being arbitraged away. Cost-per-minute varies with minimum wage legislation, contracted working hours, factory productivity and efficiency, investment in machinery, how overhead is allocated, and the obligation to pay a fair living wage rather than a bare legal minimum.
None of these is a flaw in the data. A lower cost-per-minute is not automatically the better outcome, because it has to be read against efficiency, quality, and compliance. A cheap minute on a slow, low-quality line is not cheap.
Indicative country context, 2025 to 2026
The table below positions the main China-plus-one destinations qualitatively. It deliberately avoids invented per-minute figures and instead pairs a relative cost profile with the verified sourcing variables that actually move a 2026 allocation decision.
| Country | CMT profile (basic garment) | Relative efficiency profile | Key sourcing variables (2025–2026) |
| Bangladesh | Lower | Variable, improving | High volume, basic categories, deep RMG cluster; third-largest US apparel supplier in 2025 |
| Vietnam | Mid-range | Higher productivity | Now the #1 US apparel supplier by apparel-specific share; subject to a 20% US reciprocal tariff under the October 2025 Framework Agreement |
| India | Mid-range | Diverse skill set | Product complexity and flexibility, strong vertical cotton capability; tariff structure shifting through 2025–26 |
| China | Higher | Highest productivity | Vertical integration and speed; significant UFLPA exposure; sharply reduced US demand |
| Cambodia | Lower | Emerging, scaling | Fast growth; compliance monitoring via Better Work |
| Indonesia | Mid-range | Stable | Established cluster, steady growth |
| Mexico | Higher | Speed-to-market | USMCA preference; leading nearshoring candidate |
A point worth keeping straight: Vietnam’s broad free-trade network, including CPTPP, RCEP, and the EU-Vietnam agreement, does not include the United States. US-Vietnam apparel trade runs on the 20% reciprocal tariff confirmed in the October 2025 Framework Agreement, not on preferential FTA terms. It is also worth separating the two ways the data gets cut. In apparel-specific OTEXA terms, Vietnam leads, but USFIA’s 2025 Sourcing Trends Mid-Year Update notes that China still leads when textiles and apparel are combined.
The landed-cost layer: why CM alone is not the decision
Standardising CM gives a brand a defensible foundation, not a finished answer. On top of CM, the decision has to layer import duty, which differs by HTS classification, fibre content, and the applicable US trade programme (CAFTA-DR for Central America, USMCA for Mexico, the reciprocal tariff arrangement for Vietnam, and so on), plus freight, lead-time risk, and compliance cost (UFLPA enforcement by US Customs and Border Protection, restricted substances lists, CPSIA, and ESG due diligence).
With the average applied apparel tariff moving from 14.7% in January 2025 to 26.4% by July and 35.1% by December, the duty layer above FOB grew by more than twenty points inside a single year. That volatility is the argument for standardising CM, not against it. When the duty line is a moving target, a stable, comparable cost-per-minute base becomes the one fixed point a sourcing team can plan against. Total landed-cost governance is the final decision layer, and it holds only if the CM beneath it was comparable to begin with.
Common Costing Failures: A Self-Diagnostic
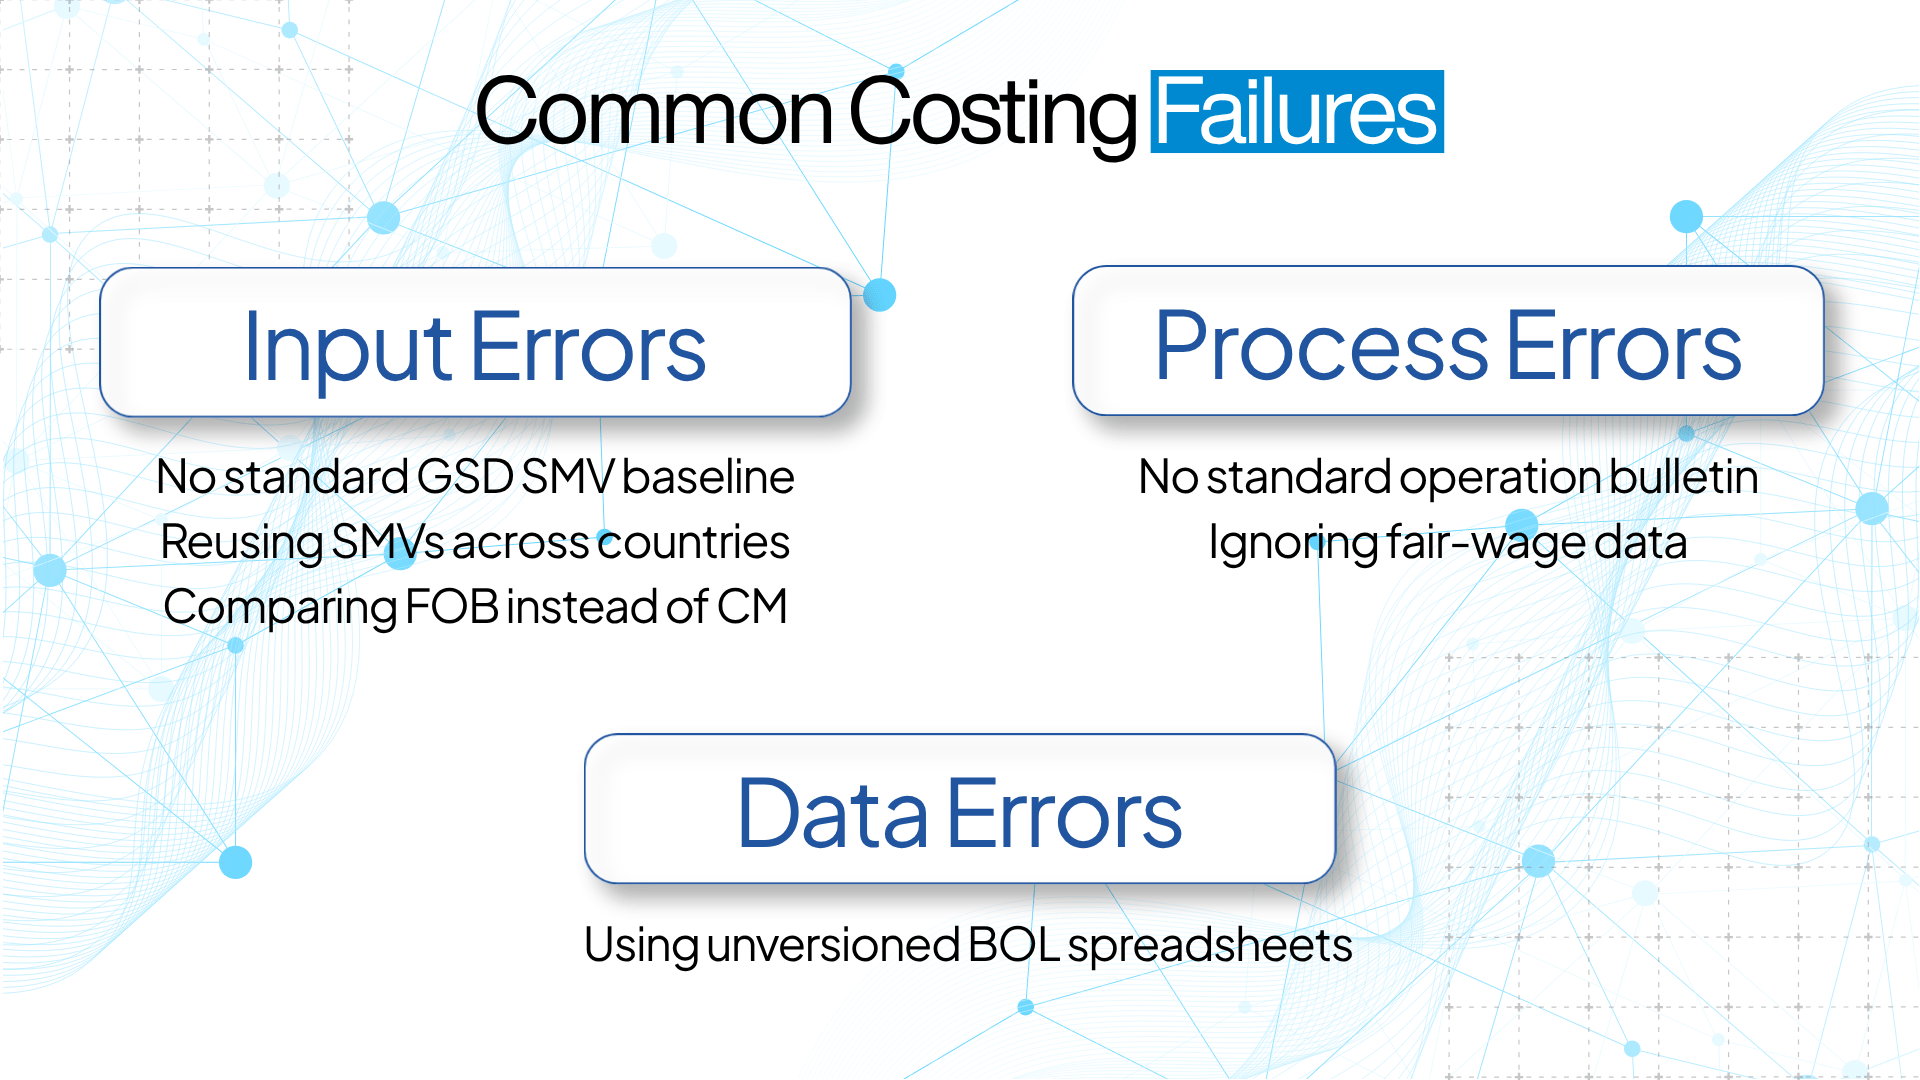
Run your current practice against the six failures below. Each one quietly breaks cross-country comparability, and most brands diversifying at speed are carrying at least two.
Errors in the costing input layer
- Accepting factory-reported SMVs without a brand-side GSD baseline. Each factory’s self-reported time reflects its own method and its own efficiency, not a standard. Without an independent baseline, the brand is benchmarking against numbers the vendors chose.
- Using one country’s SMV data to extrapolate to another. Allowances, machine types, and operator skill differ by location. A Vietnam-derived SMV cannot be assumed valid in Bangladesh without method validation. Assuming it is, bakes an error into every comparison that follows.
- Comparing FOB quotes rather than isolating CM. The comparison collapses the moment material sourcing, freight pre-payment, or margin bundling differ by country, which they always do.
Errors in the process and method layer
- Issuing tech packs without an operation bulletin. With no defined construction sequence, each factory builds its own method and produces its own SMV. Two vendors using identical fabric still return incompatible costings.
- Not requiring fair-wage compliance data with CM submissions. Under the Fair Wage Network and ILO framework, CM should reflect the actual fair living wage cost in each country. A minimum-wage assumption can conceal non-compliance and make a “cheap” quote a liability.
Errors in governance and data management
- Maintaining BOL data in country-specific spreadsheets without version control. Sourcing offices in different cities end up running different versions of the same BOL, and the cross-country comparison stops reconciling at exactly the moment, season-end, when the allocation has to be justified.
The cost of getting this wrong is concrete. Picture a US denim brand that discovers, after the season, that its CM quotes from three countries were built on three different SMV assumptions: one from a stopwatch study, one from a historical SAM average, and one from a GSD analysis. The allocation decision it made looked rigorous at the time. In hindsight, it rested on three incomparable inputs, and it cannot be defended to a CFO or an auditor. Standardisation is what makes that decision defensible before the fact, not just explainable after it.
Tools for Managing China-Plus-One Sourcing Risk
No single product manages multi-country sourcing risk. The capability is a stack, and costing standardisation is the foundation that the rest of it sits on.
Costing standardisation software
GSD/PMTS platforms such as GSDCost provide method-time-cost benchmarking from predetermined motion codes, and on the brand side, they enable the create-a-BOL, issue-to-many-vendors, compare-CM-like-for-like workflow described above.
GSDCost is deployed across major global manufacturers, including SAE-A across 41 facilities in ten countries and JD United across 31 facilities in China, Tanzania, Myanmar, and Cambodia, and its Fair Wage Tool draws on Fair Wage Network data. AI-assisted costing, specifically GSDQuest, sits on top of this to generate a standardised BOL from a product image in seconds, with a reported 90% reduction in costing time. PLM systems with costing modules centralise the product-development record but typically lack method-time-cost analytical depth. Structured Excel templates remain viable, but only for brands sourcing from fewer than three countries with a single costing lead.
Tariff, HTS, and landed-cost tooling
Alongside costing, brands need tariff classification and HTS modelling (automated HTS tools and customs-broker platforms), landed-cost calculators that integrate with FOB and CM data, and active trade-policy monitoring of USTR notices and CBP rulings. In a year where the applied apparel tariff rate moved by more than twenty points, this layer is no longer a back-office function.
Compliance and due diligence tooling
UFLPA readiness depends on supply-chain mapping and traceability, audit aggregation handles SMETA, WRAP, and Better Work data, and fair living wage compliance can be embedded directly in costing through the Fair Wage Network integration in the GSDCost Fair Wage Tool, so that wage compliance is read at the point of costing rather than bolted on afterwards.
Capacity and lead-time planning
Standardised SMV and BOL data have a second life in planning. Coats Digital’s FastReactPlan converts that data into capacity planning and order confirmation, with a reported 5 to 10% productivity improvement achieved without adding people or machines. Standalone planning and ERP tools cover the same ground with less apparel-specific depth.
Recommended stack by sourcing scale
| Brand profile | Sourcing-risk challenge | Recommended stack |
| Mid-market, 2–3 countries, under $200M revenue | Inconsistent vendor quotes; no BOL standard | GSDCost for BOL creation + structured Excel CM comparison + customs broker for tariff |
| Growing exporter-led brand, 4–6 countries | Sourcing-office silos; multiple SMV versions; UFLPA exposure | GSDCost with a centralised BOL database + GSDQuest for pre-production speed + UFLPA traceability platform |
| Large multi-category, 6+ countries, $500M+ | Full audit, fair-wage compliance, ESG reporting, tariff complexity | GSDCost enterprise + GSDQuest + FastReactPlan + landed-cost modelling + compliance platform + vendor GSD certification |
| Sourcing-office-led, 10+ vendors per season | Issuing a BOL at scale | GSDCost Costing Excellence functionality + capacity-planning integration |
Conclusion: One Language, Every Country
China-plus-one is a structural realignment of the global apparel supply chain, not a temporary tariff hedge, and the 2025 to 2026 tariff environment has only hardened it. The brands that handle a multi-country base well, will be the ones that hold every vendor to a single costing discipline, regardless of geography.
That discipline starts with method standardisation, runs through GSD-based BOL construction, and holds through centralised governance. There is a timing trap worth naming. The standard pays off most in exactly the seasons a brand is shifting volume between countries, which are also the seasons teams are too stretched to build it, so it slips, and the slip is what makes the next allocation impossible to defend. Costing standardisation sits inside a wider sourcing-risk stack alongside tariff modelling, compliance tooling, and capacity planning, but it is the layer that the others stand on. Skip it, and every season’s allocation rests on inputs that were never comparable to begin with.
The goal was never to find the cheapest country. The goal is to build the most accurate, most defensible cost-per-minute comparison across every country in the portfolio, so that allocation is decided on data rather than on whichever vendor wrote the most persuasive quote.
Where to go next:
- See how GSDCost enables brand-to-vendor BOL collaboration and like-for-like CM comparison.
- See how GSDQuest uses AI and the QED Library to generate a Bill of Labour from a product image.
- Learn how FastReactPlan converts accurate costing into capacity planning.
To see GSDCost’s brand costing functionality across a multi-vendor, multi-country portfolio, arrange a demo with the Coats Digital team.
Frequently Asked Questions
-
What is China-plus-one sourcing, and why are US brands adopting it?
China-plus-one is a strategy where a brand keeps some production in China while building capacity in at least one additional country, typically Vietnam, Bangladesh, India or Cambodia, or a nearshore market such as Mexico or Honduras. US brands have accelerated the shift because of escalating tariffs, geopolitical risk and UFLPA enforcement. According to the 2025 USFIA Fashion Industry Benchmarking Study, around 70% of US fashion companies no longer use China as their top apparel supplier, up from the 25% to 30% range before the pandemic.
-
Why can’t I just compare FOB quotes from different sourcing countries?
FOB bundles materials, Cost-to-Make, factory margin, and country-specific overhead into one number. When those components are structured differently by factory and country, an FOB-to-FOB comparison never isolates the labour cost. Two factories quoting the same FOB can have very different CM costs and efficiency. Accurate multi-country comparison requires isolating CM, and that requires a standardised SMV and a Bill of Labour applied consistently to every vendor.
-
What is a Bill of Labour, and how is it used for multi-vendor costing?
A Bill of Labour is an operation-level breakdown of every cutting, sewing and finishing step in a garment style, with a pre-assigned SMV for each operation. When a brand issues a standardised BOL to vendors across several countries at the same time, every CM quote that comes back is anchored to the same time and method assumption. The only remaining variable is cost-per-minute, which legitimately differs by country and is the correct unit of comparison.
-
What is cost-per-minute, and how do I compare it across countries?
Cost-per-minute is a factory’s total labour cost divided by its total available productive minutes per month. It translates SMV into CM cost, where CM equals total garment SMV multiplied by cost-per-minute. To compare it fairly across countries, factor in efficiency. A factory quoting a lower cost-per-minute at 55% efficiency can deliver a higher effective cost than one quoting higher at 80% efficiency. Effective cost-per-minute equals quoted cost-per-minute divided by factory efficiency.
-
What is the difference between SMV and SAM?
SMV (Standard Minute Value) and SAM (Standard Allowed Minute) are essentially the same measure under different names. Both express the standard time for a qualified operator at standard performance to complete an operation, inclusive of allowances. SMV is the more common term in PMTS-based systems such as GSDCost; SAM appears more often in traditional time-study contexts. For multi-country brand costing, alignment on the calculation method matters far more than the label.
-
Should brands use GSD/PMTS or stopwatch time study for multi-country costing?
For brand-side, pre-production, multi-vendor costing, GSD/PMTS is the practical mechanism. Stopwatch study needs a running line, produces a result specific to the factory studied, and cannot be run across vendors in several countries before production starts. GSD generates a method-anchored SMV from a construction description alone, independent of any single factory, which lets a brand issue a vendor-neutral BOL pre-sample. Stopwatch study still has value for validating in-production performance at factory level.
-
How does GSDCost help brands compare CM quotes from multiple countries?
GSDCost’s brand costing functionality, Costing Excellence, launched in June 2024, lets sourcing teams create a standardised Bill of Labour using GSD’s predetermined motion codes, issue it to several vendors at once, and compare the CM responses from one platform. Every response is anchored to the same International Standard Time Benchmarks. The platform also incorporates Fair Wage Network data and captures factory efficiency assumptions, so brands can evaluate vendors on cost, compliance and capability together rather than separately.
-
What are the biggest costing mistakes US brands make when diversifying from China?
The most common are accepting factory-reported SMVs without a brand-side GSD baseline, comparing FOB prices instead of isolating CM, failing to specify construction methods in tech packs so each factory builds its own method, not updating the Bill of Labour when methods or styles change, and keeping BOL data in separate spreadsheets by country office. That last one creates uncontrolled version proliferation, which quietly undermines cross-country comparability until the season-end reconciliation falls apart.
-
How often should I update my Bill of Labour for multi-country vendors?
Update a BOL whenever a significant construction method change is approved, a new fabric or trim alters the operation sequence, factory machinery changes the standard time, or seasonal style modifications change the operation bulletin. For brands with active multi-country vendor books, a formal BOL review tied to the product-development calendar, typically at pre-production sign-off and again at pilot-run confirmation, is the minimum governance cadence.
-
How do I account for tariffs when comparing costing across China-plus-one countries?
Model tariff impact as a separate landed-cost layer on top of the CM comparison. US import duty differs by country of origin, HTS classification, fibre content and any applicable trade programme (CAFTA-DR for Central America, USMCA for Mexico) or current reciprocal arrangement, such as the US-Vietnam Framework Agreement of October 2025, which maintains a 20% reciprocal tariff on Vietnamese-origin goods. The average applied apparel tariff rose from 14.7% in January 2025 to 26.4% by July and 35.1% by December, which materially expanded the landed-cost layer above FOB.
-
Why has Vietnam become the largest US apparel supplier in 2025?
In apparel-specific OTEXA data, Vietnam reached 21.5% of US apparel import value in 2025 against China’s 13.7%. The drivers include UFLPA enforcement constraining China-origin cotton apparel, US tariff differentials, established Vietnamese manufacturing capacity, and Vietnam’s broad FTA network (CPTPP, RCEP, EVFTA), though Vietnam-US trade itself runs on a 20% reciprocal tariff rather than preferential FTA terms. USFIA’s 2025 Mid-Year Update notes that China still leads when textiles and apparel are combined.
-
Can small or mid-market US brands standardise costing without expensive software?
Yes, with limits. A brand sourcing from fewer than three countries with a dedicated costing lead can build a workable BOL framework using structured Excel templates and GSD-trained vendor partners. The constraint is governance: spreadsheet-based BOLs degrade quickly across teams, seasons and countries without version control. Beyond three countries or five active vendors, the cost of costing errors usually exceeds the investment in a centralised platform, and most mid-market brands hit that inflection point at four or more active sourcing countries.

How Bangladesh Knitwear Factories Improve Operator Efficiency Across Sewing, Linking and Finishing

Best Lean Manufacturing Software for the Indian Garment Industry

Brand-to-Vendor Cost Collaboration: Which Layer of the Cost Stack Are You Missing?
All Blog Categories
- Production Planning
- Supply Chain Solutions
- Corporate
- Method Time Cost Optimisation
- Sustainability
- Videos